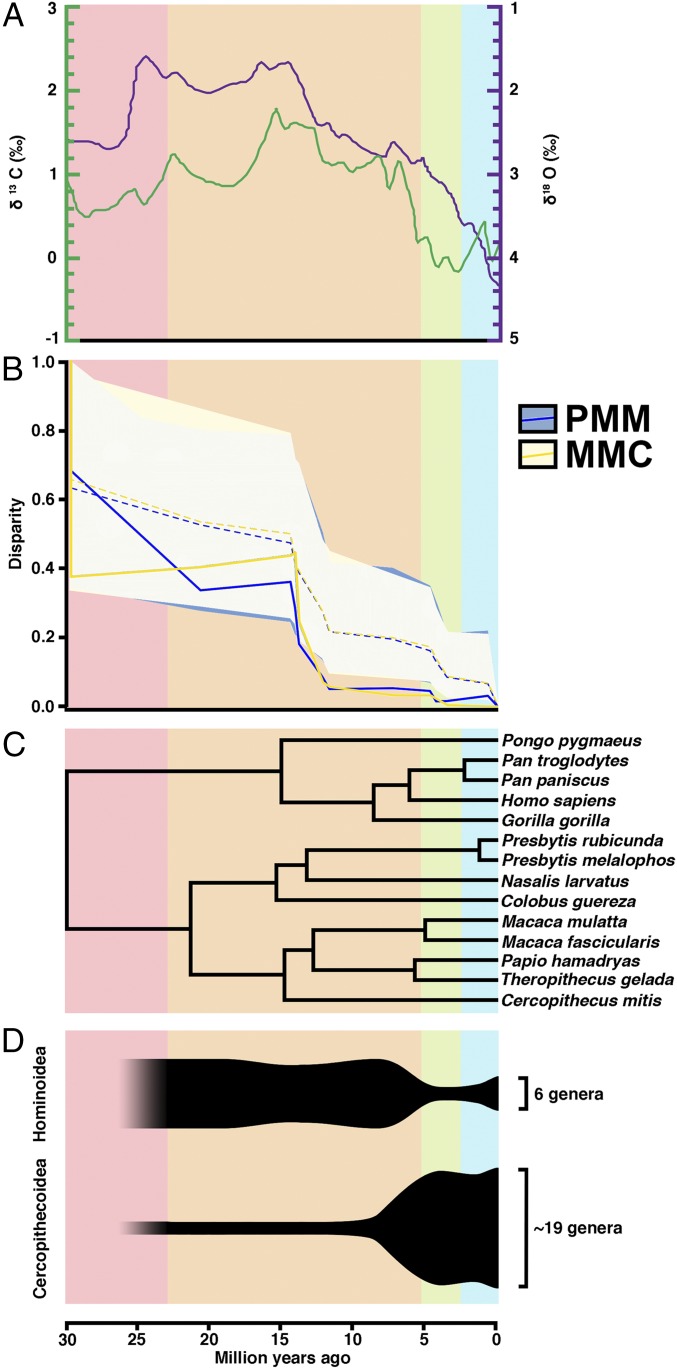
Fig. 3.
Overview of climate change, primate phylogeny, and primate taxonomic diversity compared with the evolution of the MMC and PMM. (A) Global deep-sea oxygen and carbon isotope records, adapted from a study by Zachos et al. (34). Higher δ18O values indicate cooler temperatures. The δ13C values represent different flora. (B) Our disparity through time results, which are discussed in the main text. Dotted lines indicate the predicted disparity values, and shaded areas indicate their 95% CIs. Solid lines indicate actual trait values. Values near 0 indicate that a particular clade contains little of the overall variation, and that variation in the trait is partitioned between subclades rather than within them. Values near 1.0 suggest that a clade contains a large amount of that variation, and that clades may overlap in trait space. For the PMM and MMC, trait values fall significantly below expected values beginning in the Middle Miocene, indicating trait partitioning between subfamilies within primates. Disparity through time plots of other phenotypes are provided in SI Appendix, Fig. S4. (C) Phylogeny of extant primates based on molecular data. (D) Anthropoid taxonomic diversity through time. Oligocene counts are not included because they precede the cercopithecoid–hominoid split.

