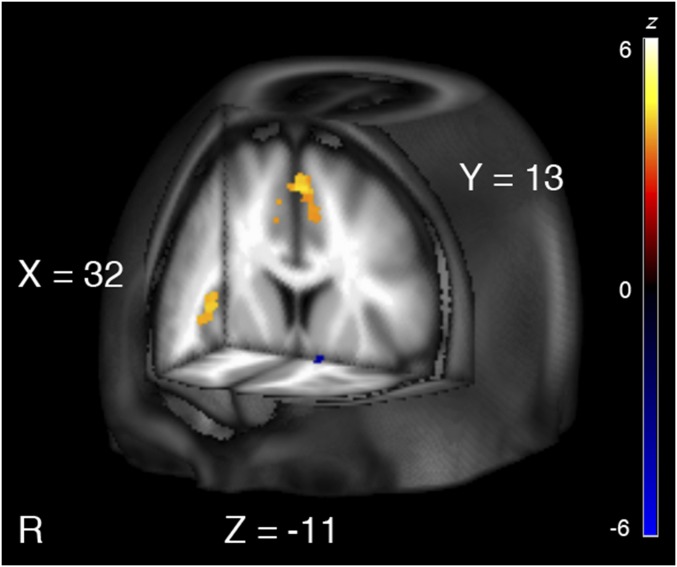
Fig. 2.
Regions responsive to prospective gains (high selling prices, low buying prices) vs. prospective losses (low selling prices, high buying prices) were tested using the task by offer interaction contrast. Differential activation was observed in the right anterior insula (depicted on the sagittal slice; peak z = 4.07; 33, 23, 6) and dACC (depicted on the coronal slice; peak z = 4.13; 0, 17, 55), key nodes of the salience network (22–24), and the left NAcc (depicted on the coronal and axial slices; peak z = −3.88; −12, 8, −12). Salience network activation was greater during losses (warm colors), whereas left NAcc activation was greater during gains (cold colors). Coordinates are in MNI space. Active clusters are FDR-corrected at P < 0.05.

