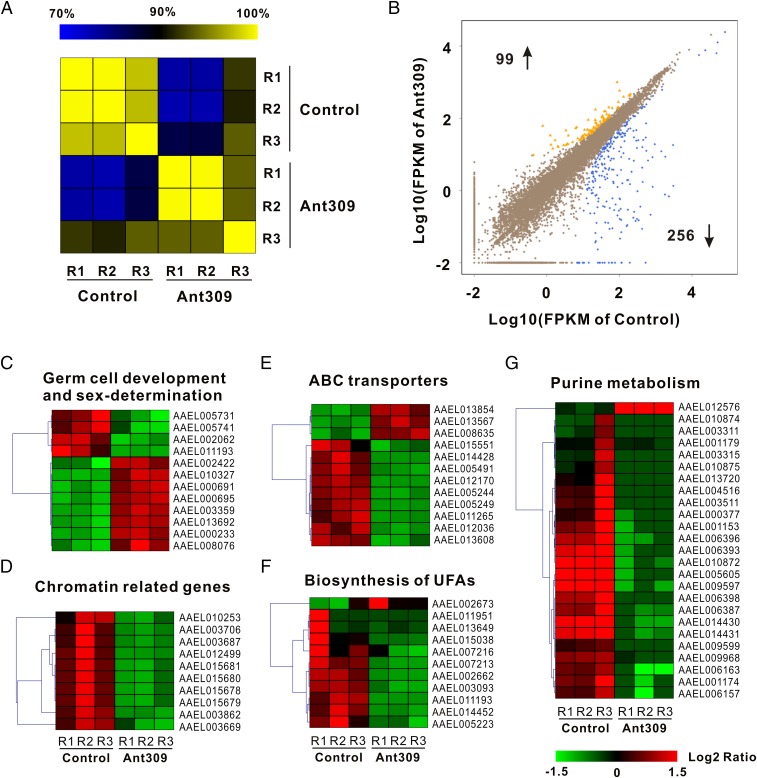
Fig. 3.
Global expression profile in response to miR-309 depletion was analyzed by means of RNA-seq quantification. (A) Heatmap showing the square of correlation value from three biological replications in control antagomir and antagomir-309 groups. The square of correlation value was assessed by using the Pearson correlation. R1, R2, and R3 indicate three independent biological replications. (B) Scatter plot presents the DEGs in ovaries after miR-309 depletion. DEGs were calculated based on an algorithm of Noiseq, with a cutoff of |log2 (RPKM ratio) | ≥1 and divergence probability ≥0.8. (C–G) Five functional gene clusters involved in ovarian development were regulated upon miR-309 depletion, including germ cell development and sex-determination, chromatin-related genes, ATP-binding cassette transporter (ABC transporters) system, biosynthesis of unsaturated fatty acids (UFAs) and synthesis, and purine metabolism pathway. The color code indicates the fold change of the gene abundance in the form of a logarithm. The RPKM of genes is normalized in each row, and the dendrograms are constructed based on an algorithm of hierarchical clustering.

