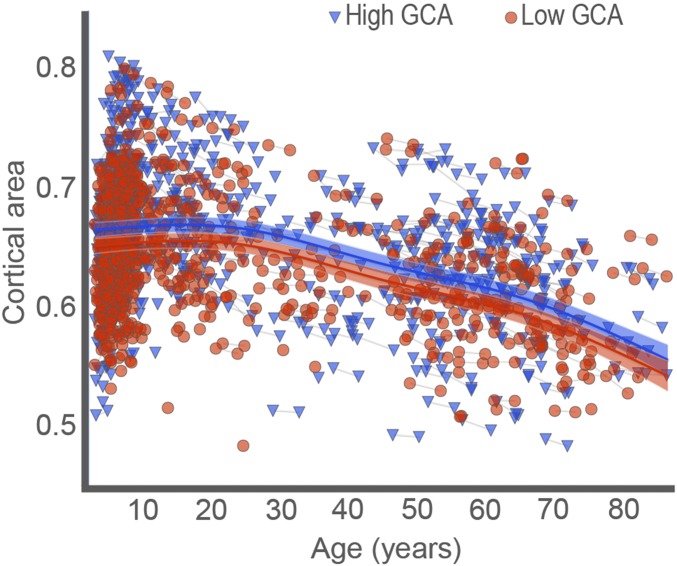
Fig. 2.
The relationships of GCA-cortical area across age. Cortical area for the regions related to GCA in children is mapped across the full age range by GAMM, using both cross-sectional and longitudinal information (1,633 observations), for participants with “higher” vs. “lower” GCA. The GCA–cortical area relationship is invariant across age, with parallel change trajectories. The width of the curve represents the 95% CI.

