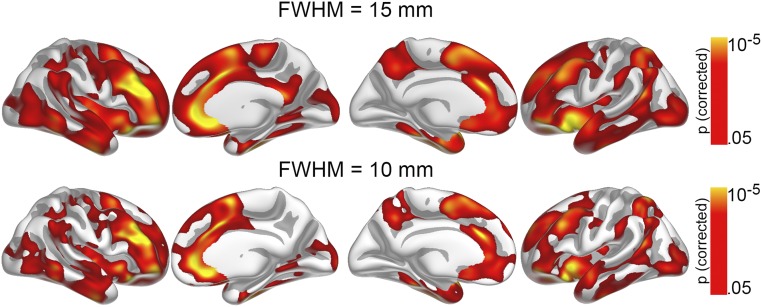
Fig. S6.
The relationship of GCA and regional cortical area as observed when using a smaller smoothing kernel. The initial analysis on the relationship of GCA and cortical area in subsample 1, with a kernel with FWHM of 15 mm, was rerun also with less smoothing (i.e., a kernel with FWHM of 10 mm), and this yielded similar, yet as expected somewhat smaller effect areas. With FWHM = 15, the total effect covered 90.883 mm2, whereas FWHM = 10 yielded an effect of 73.593 mm2, of the cortical surface of 130.437 mm2.

