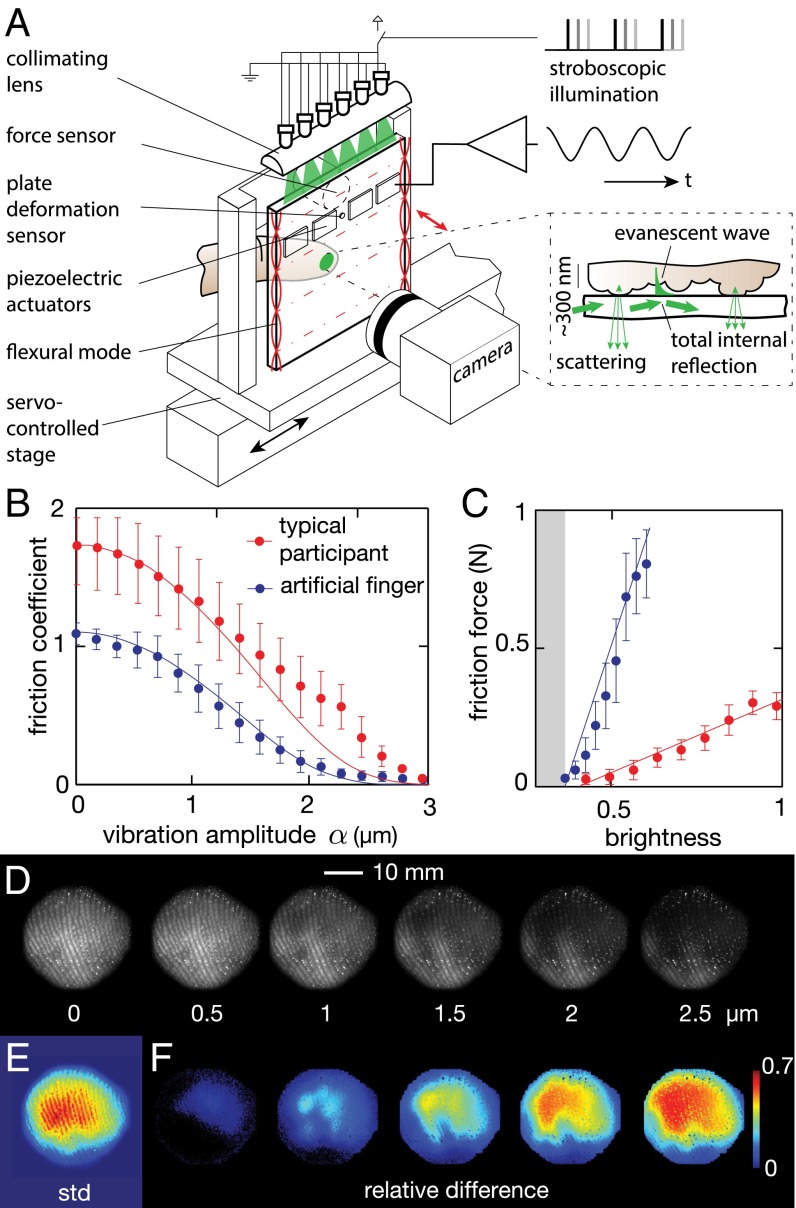
Fig. 2.
(A) Experimental setup. The vibrating plate is mounted on a servo-controlled stage equipped with a six-axis force sensor. Illumination from the side of the plate provides a uniform illumination of the true contact area through frustrated total internal reflection (A, Inset). (B) The sliding friction force gradually decreases with increasing vibration amplitude. The line represents the (C) brightness and friction force correlation. The illumination technique reveals those asperities that are within a few hundred nanometers of the plate; therefore, the spatial average of the brightness received by the camera is linearly correlated with the friction force and under the adhesive theory of friction, linearly correlated with the true area of contact. (D) Images of the contact area under ultrasonic vibration amplitudes of 0–2.5 μm. (E) Spatial distribution of the variation of brightness over a cycle where the amplitude of stimulation is slowly varying. The center of the contact experiences the most variation, whereas the edge remains unaffected. (F) The difference between the brightness at selected amplitudes and the brightness at rest highlight those areas that are more or less affected by vibration.

