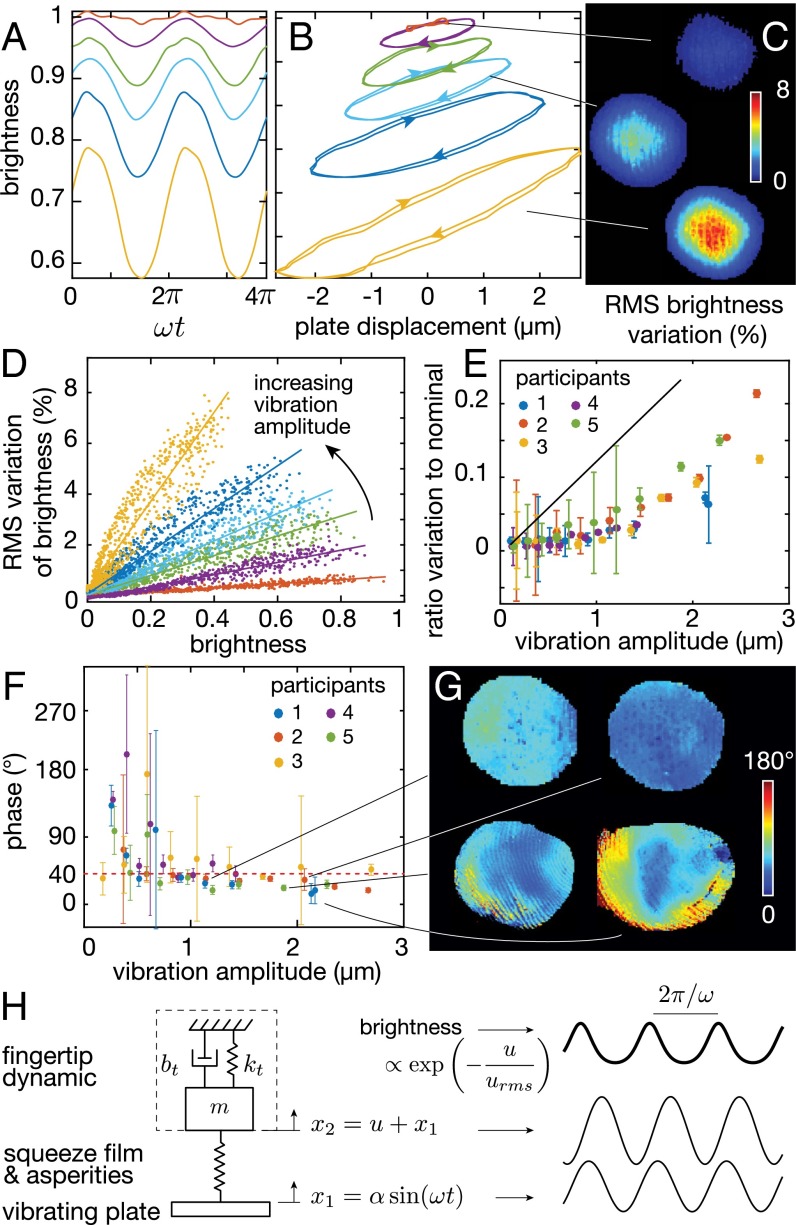
Fig. 4.
(A) Time domain variation of brightness. Changes in brightness closely follow a sinusoidal pattern. (B) Phase portrait of brightness and plate position. Increased amplitude decreases the average brightness but increases the variation. (C) Selected images of the spatial distribution of brightness variation. (D) Variation and average brightness are correlated in each image. The lines are linear regressions. (E) The ratio is a function of the amplitude of stimulation. The prediction from a model with large skin roughness is in black. (F) Phase between motion of the plate and the interfacial separation as a function of amplitude and participant. (G) Selected spatially distributed phase plots. Large variations of phase occur across trials. (H) Simplified linear model of the skin bouncing off the film of air leads to behaviors similar to the experimental observations.

