Fig. 5.
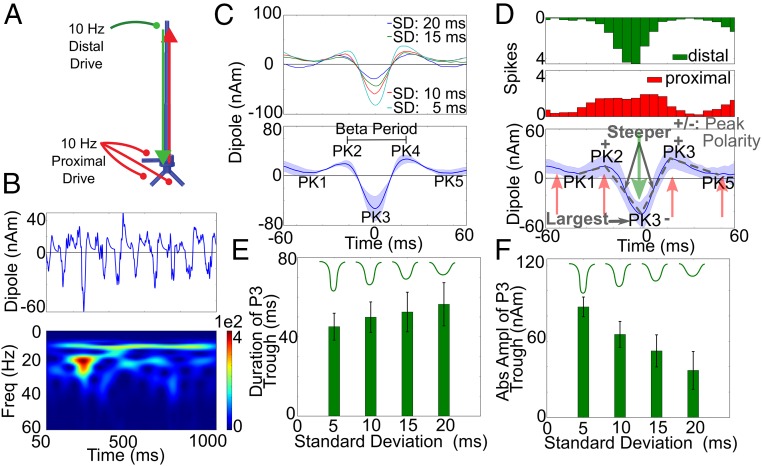
Nearly simultaneous 10-Hz proximal and distal drives reproduced additional beta event waveform features, and PK3 was dependent on the distal drive. (A) Illustration with 10-Hz proximal and distal drives. (B) Example of a dipole time course and spectrogram over 1 s [distal SD, 15 ms; proximal SD, 20 ms; mean delay, 0 ms, units: (AM)2] exhibiting high-power beta events. (C, Upper) Average current source waveform during 50 high-power beta events for each of four different SD of the distal drive burst. (Lower) Averaged data for the four different SD. (D) Histogram of driving spikes during 50 high-power beta events as in B (distal SD, 15 ms) and mean and SD of corresponding waveforms. Beta event waveforms consistent with the human data emerged (SI Appendix, Table S3), as did the PK1 and PK5 troughs and the rising endpoints of the beta event waveform observed in the average human data (Fig. 1B). (E and F) Duration and peak amplitude of the PK3 for the four SDs of distal drive.

