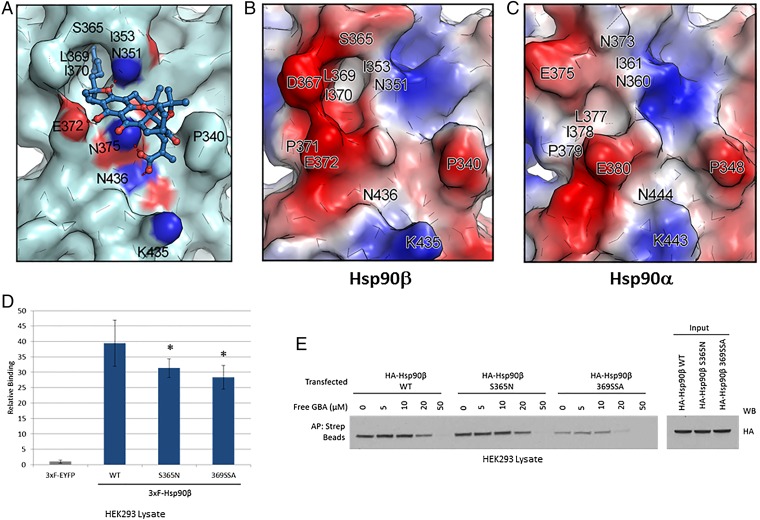
Fig. 5.
Molecular docking model of GBA bound to Hsp90β. (A) Molecular modeling suggests that GBA (shown in blue stick representation) binds to a pocket within a region composed of residues 350 to 436 in Hsp90β (shown in pale cyan). Hydrogen bonds formed between GBA and the pocket are shown as red dashed lines. Oxygens are shown in red and nitrogens are shown in blue. (B and C) Surface electrostatic potential map of Hsp90β (residues 350 to 436) and Hsp90α (residues 359 to 444). Red, blue, and white colors correspond to negatively charged, positively charged, and neutral areas, respectively. (D) LUMIER analysis showed decreased GBA binding to 3×F-Hsp90β S365N and 3×F-Hsp90β 369SSA (the triple mutant L369S, I370S, E372A) compared with wild-type 3×F-Hsp90β. Error bars represent SDs. *P < 0.05 relative to wild-type. (E) HEK293 cells were transfected with HA-Hsp90β, HA-S365N, or HA-369SSA. The next day, cells were lysed and increasing amounts of Bio-GBA were used to pull down Hsp90β from cells expressing equivalent amounts of wild-type HA-Hsp90β or the mutants HA-S365N and HA-369SSA. The binding-pocket mutants displayed reduced ability to bind to Bio-GBA, consistent with the data obtained by LUMIER.

