Fig. 3.
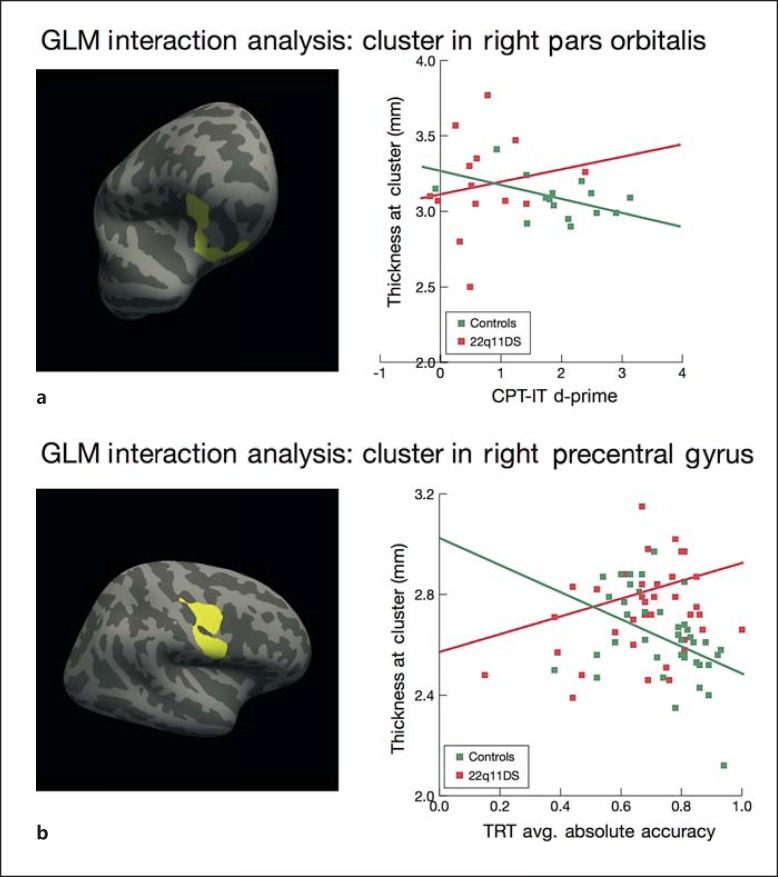
a Relationship between performance on the CPT-IP and cortical thickness in patients with 22q11DS vs. controls. Whole-brain vertex-wise analysis revealed a significant group by task interaction in the right pars orbitalis region of the IFG (cluster size 919.46 mm2, p < 0.05, corrected), indicating that the relationship between CPT-IP performance, as assessed by d-prime, and thickness in this region differs between patients with 22q11DS and controls. In patients with 22q11DS, increased cortical thickness in the IFG was associated with higher d-prime scores, whereas in controls, increased cortical thickness in this region was associated with lower d-prime scores. b Relationship between performance on the TRT and cortical thickness in patients with 22q11DS vs. controls. Whole-brain vertex-wise analyses revealed a significant group by task interaction in the right precentral gyrus (cluster size 1,434.62 mm2, p < 0.05, corrected), indicating that the relationship between TRT and thickness in this region significantly differs between patients with 22q11DS and controls. In patients with 22q11DS, increased cortical thickness in the precentral gyrus was associated with higher accuracy scores, whereas in controls, increased cortical thickness in this region was associated with lower accuracy scores.

