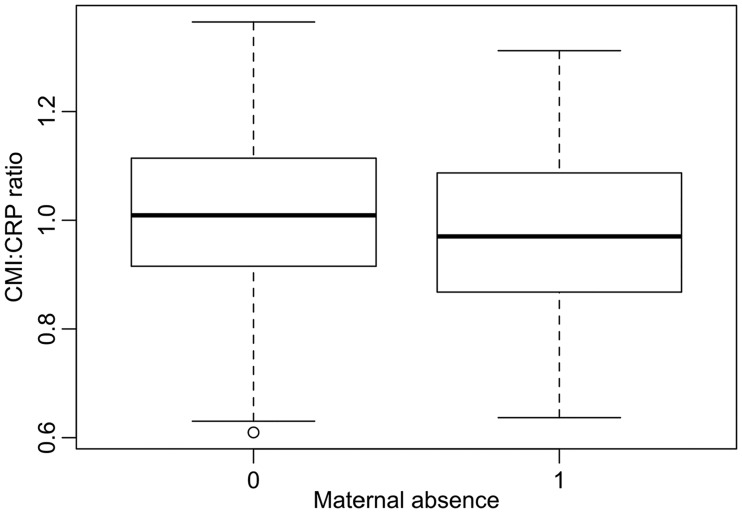
Figure 3.
Difference in CMI:CRP ratio between individuals who experienced maternal absence and those who did not. Boxplots show the median (thick line), the inter-quartile range (box), range (whiskers), excluding outliers (open circles, over 1.5 times the interquartile range from the box) (statistical details are shown in Table 2)

