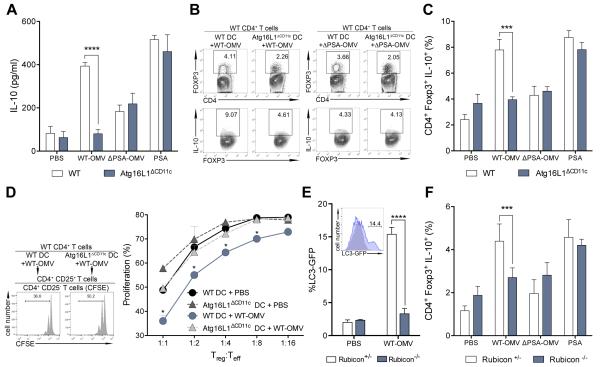
Fig. 1. ATG16L1 signals via a non-canonical autophagy pathway during OMV-mediated Treg induction.
(A) ELISA for IL-10 production during DC–T cell co-cultures with WT or Atg16L1ΔCD11c BMDCs treated with PBS, B. fragilis WT-OMV, ΔPSA-OMV or purified PSA. (B and C) Representative flow cytometry plots (B) and frequency (C) of CD4+Foxp3+IL-10+ Tregs from DC–T cell co-cultures with WT or Atg16L1ΔCD11c DCs treated with PBS, B. fragilis WT-OMV, ΔPSA-OMV or purified PSA. (D) T cell suppression assay analyzing in vitro generated Tregs from WT or Atg16L1ΔCD11c DCs treated with WT-OMVs. (E) Quantification of LC3-GFP accumulation by B. fragilis WT-OMV treatment of Rubicon+/− or Rubicon−/− DCs. Representative flow cytometry histogram plot (inset). PBS, grey; WT-OMV, blue. (F) Frequency of CD4+Foxp3+IL-10+ Tregs from Rubicon+/− or Rubicon−/− DC–T cell co-cultures treated with PBS, B. fragilis WT-OMV, ΔPSA-OMV or purified PSA. Error bars represent S.E.M. * p < 0.05, *** p < 0.001, **** p < 0.0001. Two-way ANOVA, followed by Tukey’s post-hoc analysis. Data are representative of at least 2 independent experiments.

