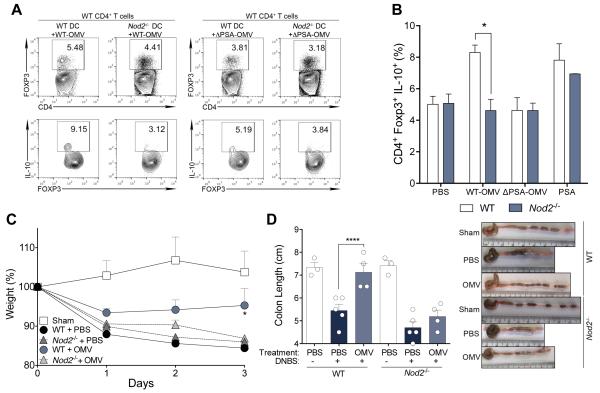
Fig. 3. NOD2 is required for OMV-mediated Tregs induction and protection from colitis.
(A and B) Representative flow cytometry plots (A) from WT-OMV (left) and ΔPSA-OMV (right) treated BMDCs co-cultured with CD4+ T cells, and frequency (B) of CD4+Foxp3+IL-10+ Tregs from DC–T cell co-cultures. (C and D) Weight loss (C), colon length and gross pathology (D) of WT or Nod2−/− mice treated with PBS or B. fragilis WT-OMV during DNBS colitis. Error bars represent S.E.M. * p < 0.05, ****p < 0.0001. Two-way ANOVA, followed by Tukey’s post-hoc analysis. Data are representative of at least 3 independent experiments, with 3-5 mice/group.

