
Figure 1.
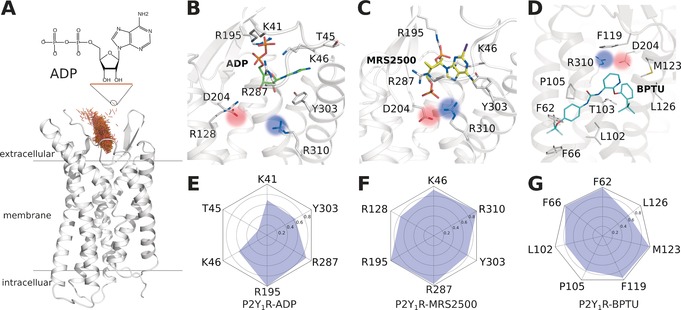
The ligand binding modes of P2Y1R at the end of MD simulations. A) The entrance pathway of ADP into the receptor represented as superposition of the mass centers of ADP over a time period of 0.2 μs (brown points). B) ADP binding mode. C) MRS2500 binding mode. D) BPTU binding mode. E–G) Interaction fingerprint of P2Y1R with bound ADP (E), MRS2500 (F), and BPTU (G).