
Figure 2.
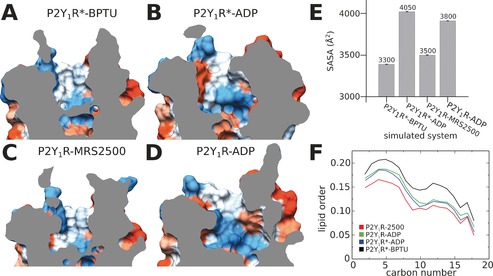
Solvent‐accessible surface area (SASA) and lipid order of P2Y1R at the end of MD simulations. The binding pocket of P2Y1R*‐BPTU (A), P2Y1R*‐ADP (B), P2Y1R‐MRS2500 (C), and P2Y1R‐ADP (D). E) SASA values of P2Y1R calculated from the final 0.5 μs MD simulations. F) Lipid order parameters averaged over the final 0.5 μs MD simulations.