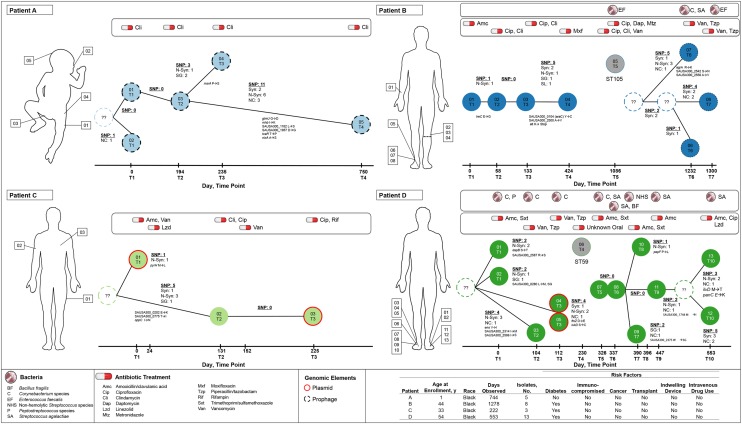
Figure 2.
Time-scaled minimum spanning trees of 4 patients (A–D). The number and annotation of single-nucleotide polymorphisms (SNPs) are labeled on branches linking nodes (unique isolates). The sampling date and time point, which correspond to the clinical histories in Table 1, are specified on the x-axes. Synonymous (syn), nonsynonymous (N-syn), stop gained (SG), start lost (SL), and noncoding (NC) are labeled, as well as the gene name and amino acid change. Node labels correspond to Table 2. Nodes labeled with question marks and dashed outlines represent unsampled intermediate ancestors. Gray nodes are non-USA300 methicillin-resistant Staphylococcus aureus isolates. The red node outline specifies isolates with identified plasmids, and black dashed outlines represent isolates with bacteriophages. This figure is available in black and white in print and in color online.

