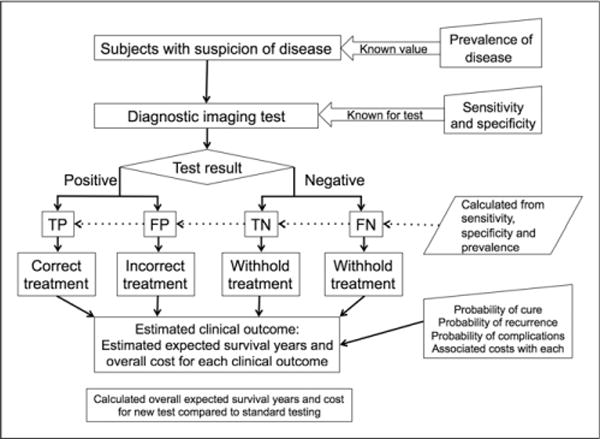
FIGURE 1.

Scheme for modeling the outcomes expected for a new medical test. Although the process of defining disease incidence and test sensitivity and specificity is straightforward, it is more challenging to define treatment impact (probability of cure and of complications) and to estimate survival and costs for each test-result pathway. FN = false-negative; FP = false-positive; TN = true-negative; TP = true-positive.
