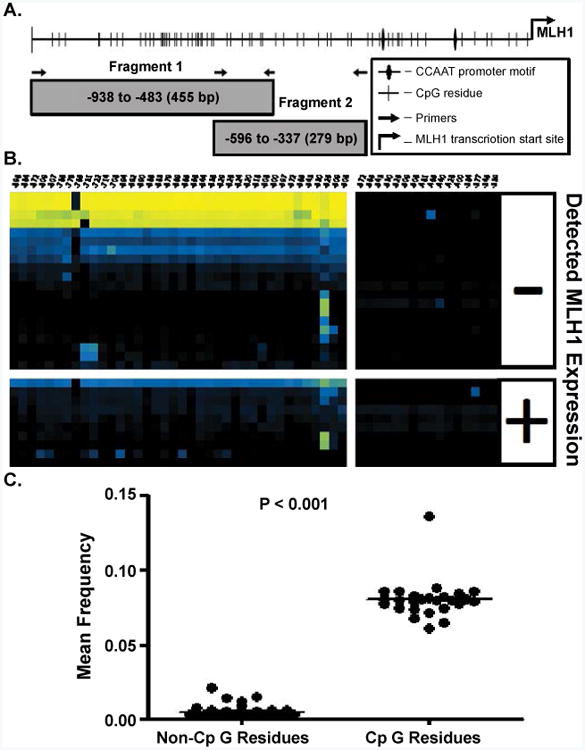
Figure 1.

A) An illustration of the MLH1 promoter region identifying the MLH1 transcriptional start site, CpG residues, CCAAT box, and primer binding locations. CpG sites are numbered from the transcription start site located at position 0, NCBI sapiens chromosome 3 genomic contig, GRCh37.p9 Primary assembly Reference Sequence NT_022517.18 Fragment 1 CpG residues are located at: -896, -884, -872, -809, -807, -786, -776, -765, -731, -722, -714, -708, -694, -692, -690, -686, -683, -679, -669, -665, -656, -644, -636, -629, -626, -624, -620, -618, -608, -600, -597, -572, -565, -543, -530, -525, -509, and -506 bp and Fragment 2 CpG residues are located at: -572, -565, -543, -530, -525, -509, -506, -481, -465, -449, -428, -400, -384, -377, -345, and -339. B) Bias corrected CpG methylation frequency is depicted as a heat map, each block representing the frequency of methylation at a single CpG within a single CFC sample. The methylation frequency at CpG residues are read from right to left along horizontal axis. Each row represents a unique CFC and each column represents a specific CpG. The frequency scale is generated with (
 ) yellow is equivalent to a frequency of 1.0, blue (
 ) a frequency of 0.5 and black (■) a frequency of 0.0. C) A T-test comparison of the mean frequency of all non-CpG site methylation events to the total frequency of methylation at CpG residues.
