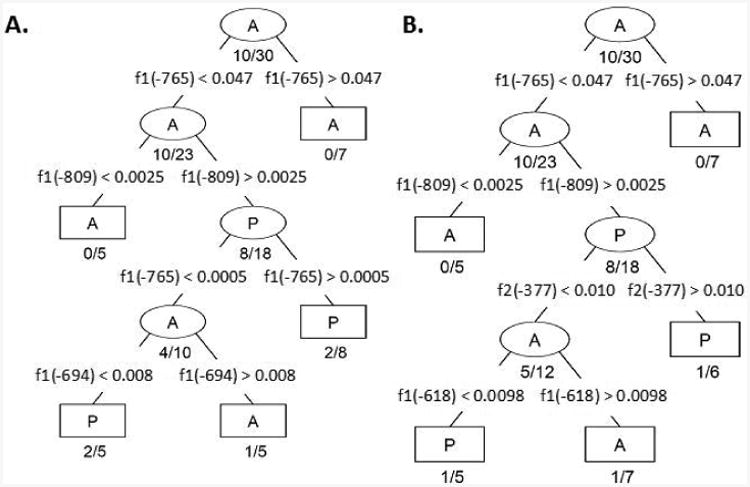
Figure 4.

CART Decision algorithms generated with CpG methylation frequencies from A) Fragment 1 (f1) and B) Fragment 2 (f2) combined. Each branch node (ellipse) defines a branch point which filters CFC into progressively more homogenous classes. The terminal nodes (rectangles) indicate no further partitioning is necessary (either the size of the node is small or the node is sufficiently homogeneous). Branch nodes are labeled with the majority CFC expression identity; as labeled with an A to indicate the majority CFCs classified within a node lack MLH1 expression while P indicates the majority of CFC expressed MLH1. Misclassification ratio is indicated below each branch and terminal node. The segregating parameter is indicated by the CpG residue location followed by an inequality statement and CpG methylation value indicating the optimal threshold between the two nodes.
