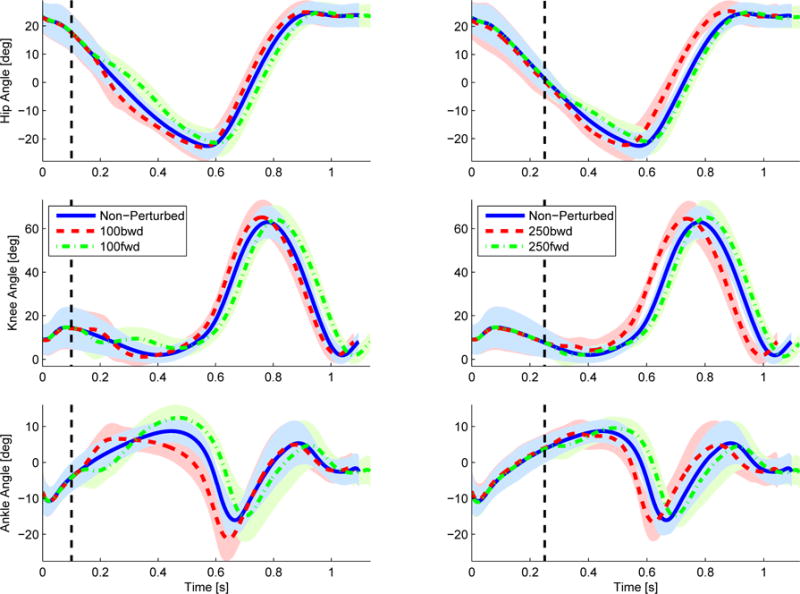
Fig. 11.

Hip, knee, and ankle angles of the initiating leg (i.e., leg stepping on the force plate) over time with and without perturbations occurring at 100 ms (left) and 250 ms (right) after IC. The shaded region represents one standard deviation away from the mean.
