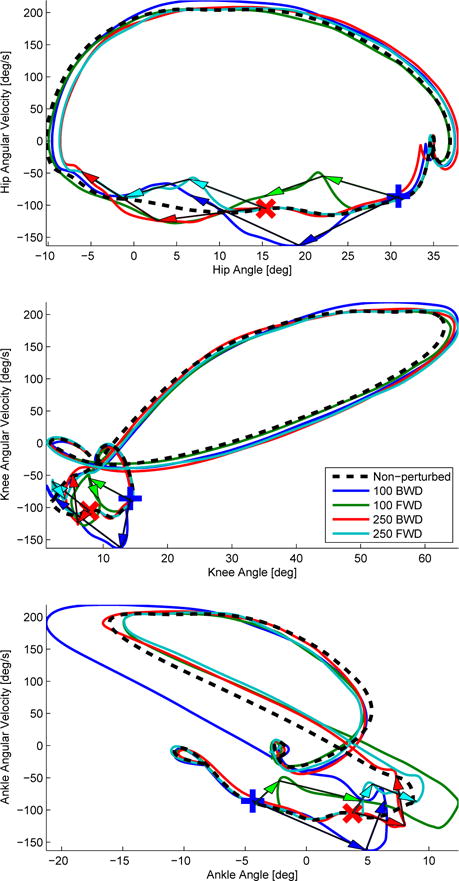
Fig. 12.

Phase portraits across different perturbation conditions of the perturbed leg joint angle trajectories: hip (top), knee (middle), and ankle (bottom). The length of each arrow represents a 100 ms time difference between the origin and the head of the arrow. The head of the arrow is pointing towards the motion of the phase portrait. Note that the second arrows (representing 200 ms after perturbation onset) point approximately back to the nominal orbits. The blue plus sign and red cross sign represent the 100 ms and 250 ms perturbation onset times after initial contact, respectively.
