Fig. 8.

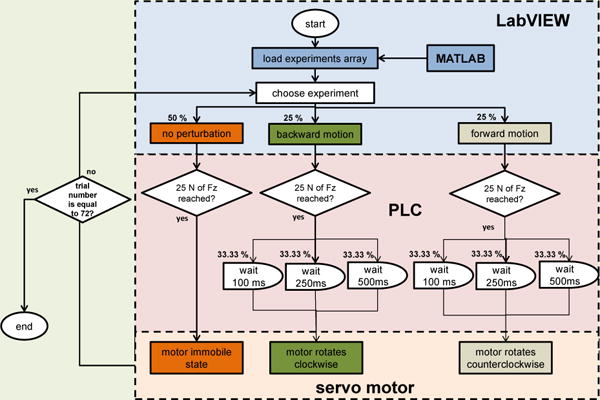
Flow diagram of the algorithm used to control the perturbation mechanism across all trials. The percentages represent the probability of incidence of each experiment across all trials.

Flow diagram of the algorithm used to control the perturbation mechanism across all trials. The percentages represent the probability of incidence of each experiment across all trials.