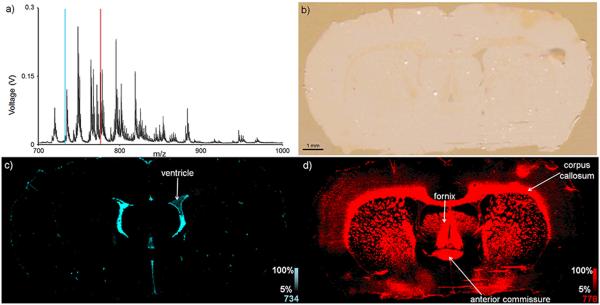
Figure 3.
A 39,073 pixel MALDI image of a coronal rat brain section was sampled at 50 μm spatial resolution and was acquired in approximately 45 minutes. a) An average mass spectrum of 100 pixels shows the various lipid ions that were detected. b) A scanned optical image shows the tissue section following MALDI matrix application. Ion images of nominal masses c) m/z 734 and d) m/z 778 are plotted as m/z 734.6±0.6 and m/z 778.6±0.6, respectively, and show differential localization in brain substructures.

