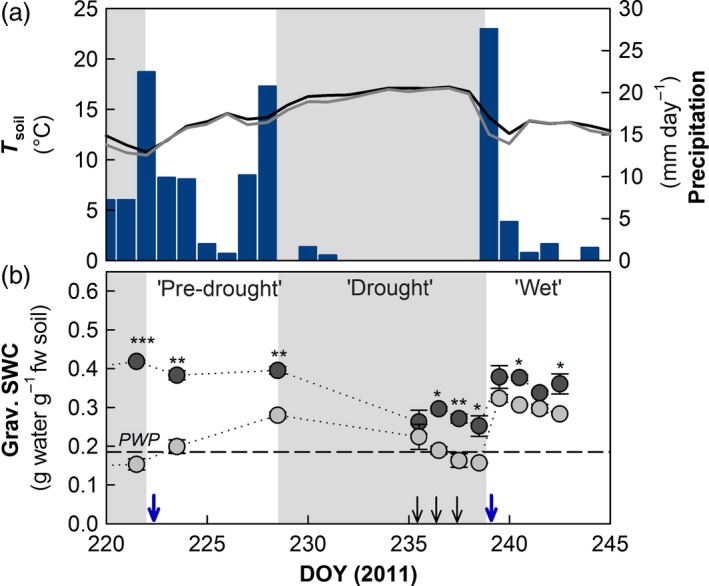
Figure 1.

Microclimatic conditions during the experimental period in 2011. (a) Daily means of soil temperature (T soil) at 10 cm soil depth in ambient controls (AC, black line) and plots with drought history (DH, grey line) and daily sums of precipitation in mm (blue bars). (b) Gravimetrically determined soil water content (SWC, g water g−1 fresh soil; n = 3; ± SE) AC plots (black circles) and in DH plots (grey circles); differences at single samplings were assessed by paired t‐test after Bonferroni correction (asterisks mark levels of significance: *P < 0.05, **P < 0.01, ***P < 0.001). The dashed line marks the SWC equalling to the permanent wilting point (PWP) for plants at a pF of 4.2. Blue arrows indicate the end of the experimental and the natural drought, black arrows indicate the three subsequent days of 13C pulse labelling. The grey background marks periods of experimental rain exclusion and the natural drought.
