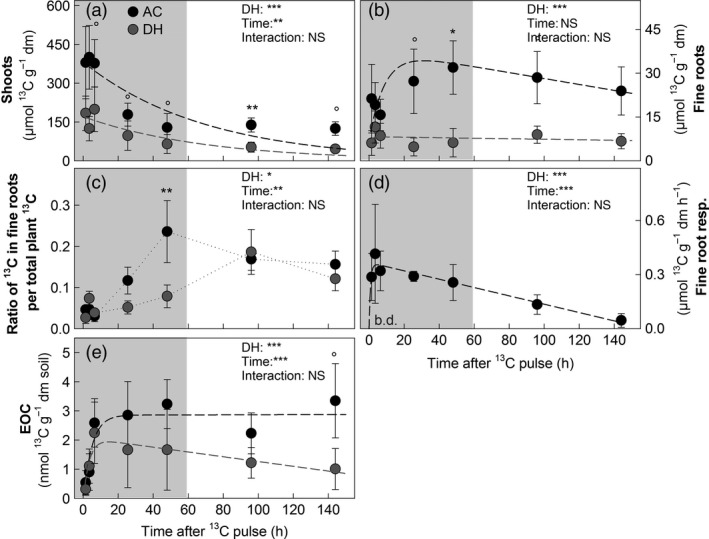
Figure 3.

Pulse labelling‐derived 13C (i.e. excess 13C) in ambient controls (AC, black circles) and drought history (DH, grey circles) plots over time in (a) plant shoots, (b) fine root biomass, (c) the proportion of 13C excess in fine roots per total plant 13C excess (sum of shoot and fine roots), 13C excess in (d) fine root respiration (b.d. below detection limit), (e) soil extractable organic C pool (means; n = 3, ± SE, respectively). In (a–e) nonlinear regressions (dashed lines) describe the 13C dynamics in AC (black) and DH plots (grey). The grey background indicates samples taken during natural drought; the other samples were taken after subsequent rewetting. Effects of DH treatment and time after labelling were assessed by two‐way repeated‐measures anova; asterisks mark significant differences at single samplings (paired t‐tests, Bonferroni corrected; °P < 0.1; *P < 0.05, **P < 0.01; ***P < 0.001) (See Table 2 and Table S2 for detailed statistical information and model fittings, respectively).
