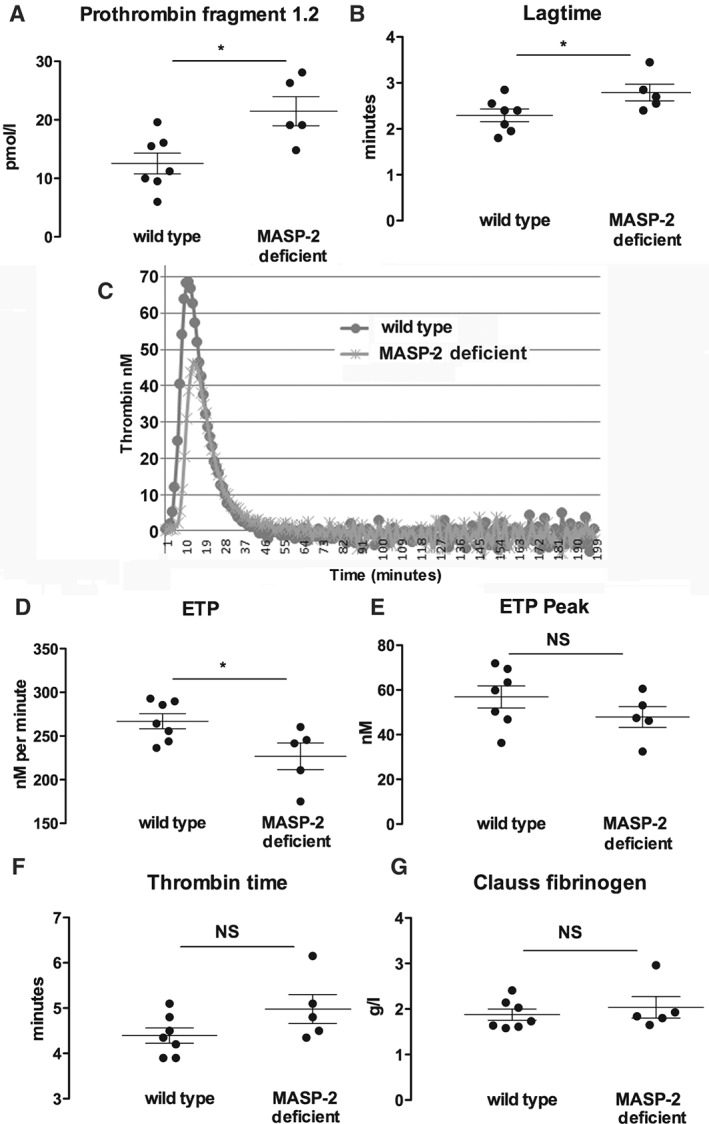
Figure 5.

Coagulation parameters in plasma from untreated wild‐type or MASP‐2‐deficient mice. Each graph represents the parameter indicated, with panel C showing typical profiles for thrombin generation over time. Each symbol represents plasma from a separate mouse. *p < 0.05. Error bars are mean ± SEM.
