
Figure 5.
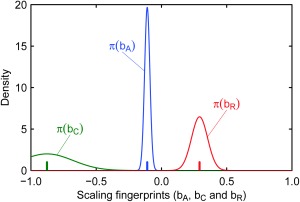
Scaling fingerprints bA, bC, and bR obtained through simplified rainfall‐runoff modeling (section 4.2) and to be used as prior information in the Bayesian regional attribution (section 4.3). For exact prior information on the scaling fingerprints (Figures 6a and 6b), the mean values represented by the spikes are used. For uncertain prior information on the scaling fingerprints (Figures 6c and 6d), normal distributions with mean and variance equal to those of the density functions shown here are used.