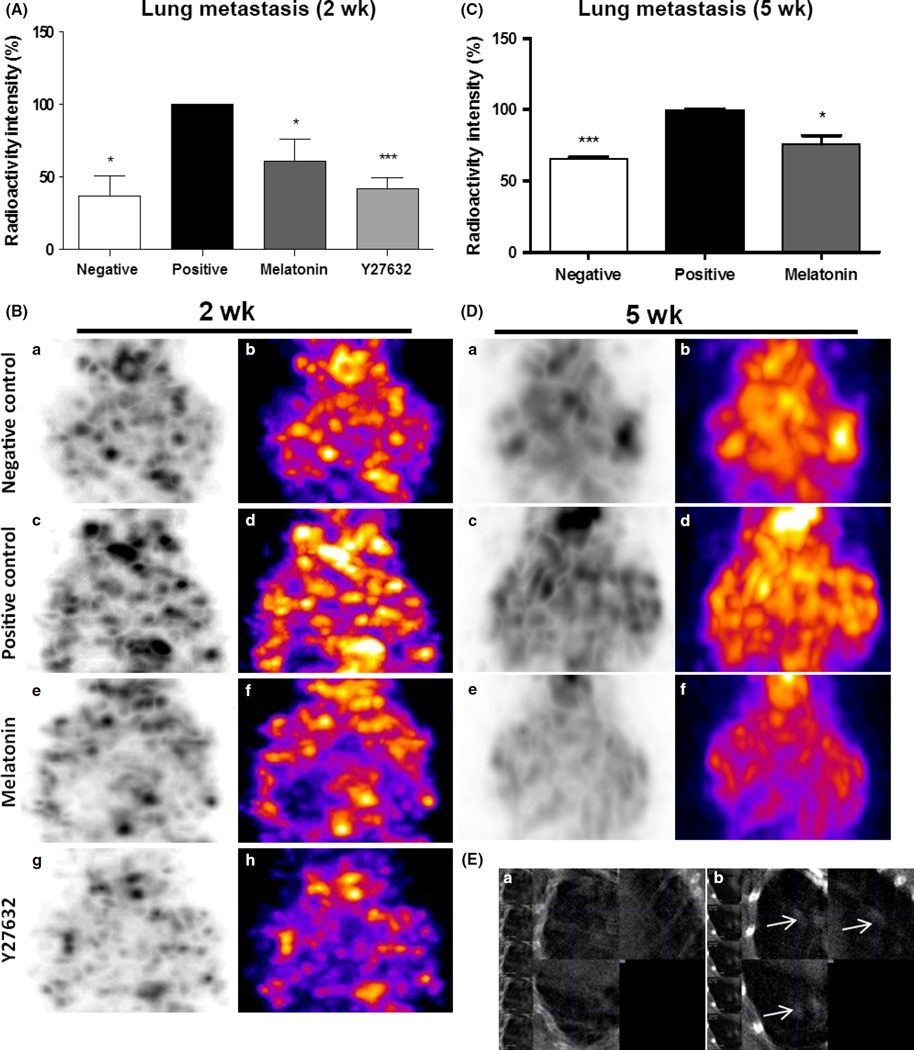
Fig. 4.
Lung metastasis after 2 and 5 wk of melatonin and Y27632 treatments. Semiquantitative analysis of radioactivity intensity by single photon emission computed tomography (SPECT) images following (A) 2 wk of treatment and following (C) 5 wk of treatment. SPECT images obtained after injection of the 99mTc-tetrofosmin showing lung metastasis following (B) 2 wk of treatment and following (D) 5 wk of treatment. (a) and (b) negative control, (c) and (d) positive control, (e) and (f) melatonin treatment, (g) and (h) Rho-associated kinase protein (ROCK)-1 inhibitor (Y27632) treatment. (E) High-resolution computed tomography images at 25-µm thickness. (a) Control animal without metastasis; (b) positive control animal without treatment showing high-density area (white arrow) indicating lung metastasis in animal after 6 wk following induction of lung metastasis. Significant value in ANOVA followed by Bonferroni’s test (±S.E.M. *P < 0.05; ***P < 0.0001).

