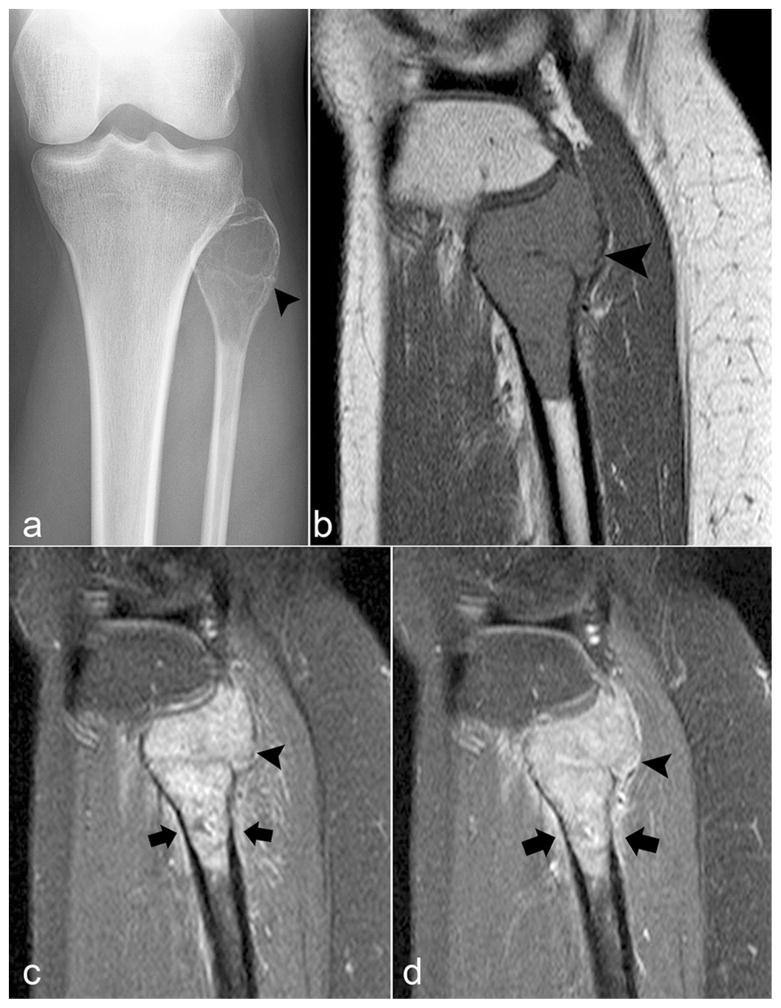
Fig. 2.
Giant cell tumor of bone of the fibula. a) Anteroposterior view radiograph shows an expansile lytic lesion in the proximal fibula causing marked cortical thinning (arrowhead). b) Sagittal T1-weighted image demonstrates the diffusely low signal. c) Fat-suppressed sagittal T2-weighted image and d) fat-suppressed contrast-enhanced sagittal T1-weighted image demonstrate mild extraosseous soft tissue (arrowhead) and periosteal edema and enhancement (arrows) in the adjacent bone and soft tissue

