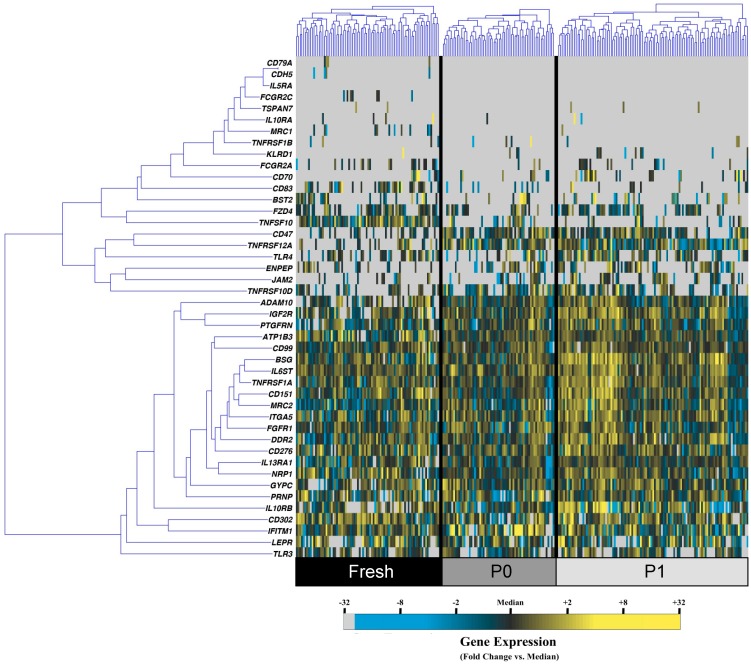
Figure 1.
Single cell transcriptional analysis of fresh, passage 0, and passage 1 adipose-derived stem cells. Hierarchical clustering of simultaneous gene expression for single cells from fresh (left; black), passage 0 (middle; dark grey), and passage 1 (right; light grey) human adipose-derived stem cells (ASCs). Gene expression is presented as fold change vs. median on a color scale from yellow (high expression, 32-fold above median) to blue (low expression, 32-fold below median). Cell/gene qPCR reactions failing to amplify after 40 cycles are designated as non-expressers and represented in grey.

