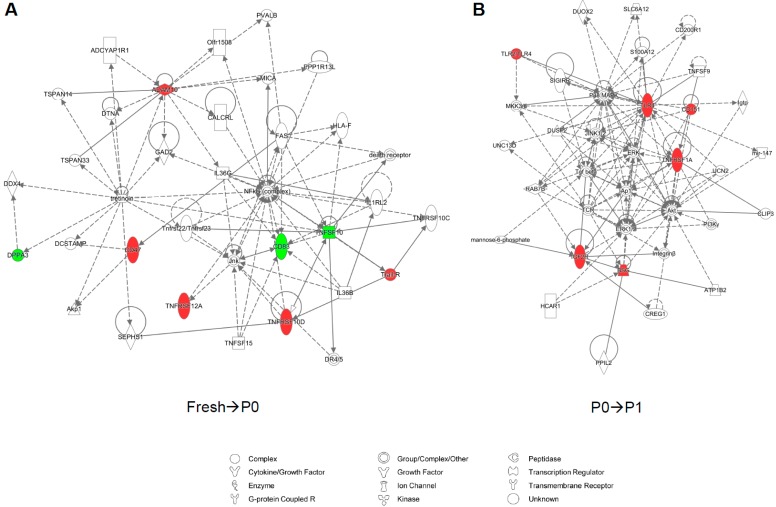
Figure 3.
Network analysis of gene expression changes in of fresh, passage 0, and passage 1 adipose-derived stem cells. Top scoring Ingenuity Pathway Analysis (IPA)-constructed transcriptome networks based genes that were significantly up-regulated in fresh→P0 (A) and P0→P1 (B) human adipose-derived stem cells (ASCs). Direct relationships are indicated by solid lines, and dashed lines represent indirect relationships.

