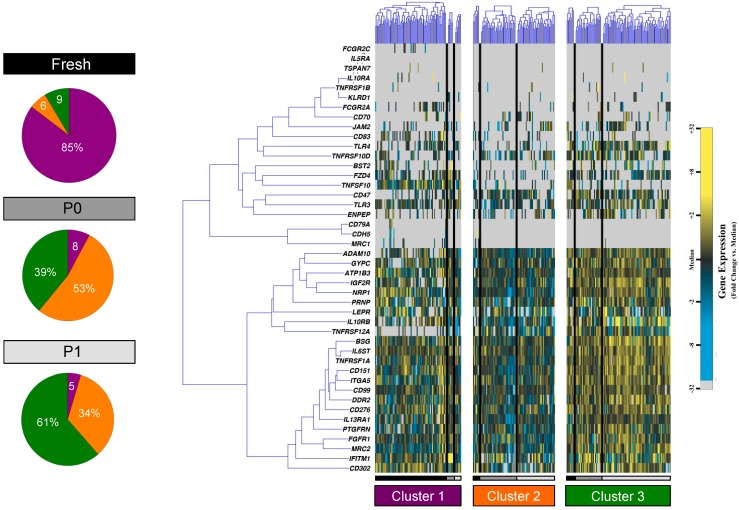
Figure 4.
Partitional cluster analysis of single cell adipose-derived stem cell data across cell culture passage. K-means clustering of fresh (black), passage 0 (dark grey), and passage 1 (light grey) human adipose-derived stem cells (ASCs). Gene expression is presented as fold change from median on a color scale from yellow (high expression, 32-fold above median) to blue (low expression, 32-fold below median). Pie graphs represent the fraction of cells comprising each cluster from fresh, passage 0 (P0), and passage 1 (P1) cells, colored in purple, orange, and green in accordance with clusters 1, 2, and 3, respectively.

