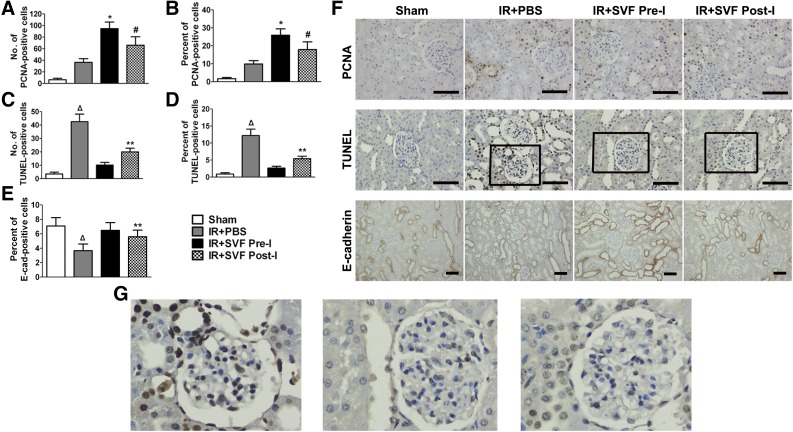
Figure 5.
Immunohistochemical staining of PCNA, E-cadherin, and TUNEL staining in kidney sections at 72 hours after IR in different groups. (A–E): Quantitative analysis of PCNA-positive cells (A, B), TUNEL positive cells (C, D), and E-cadherin-positive cells (E) was performed by using Image-Pro Plus software. (F, G): Representative images of PCNA, E-cadherin, and TUNEL staining in the kidneys at 72 hours after IR at different groups (magnification, ×400 [PCNA and TUNEL staining], ×200 [E-cadherin staining]). Scale bars = 50 μm. ∗, p < .05 (vs. sham, IR+PBS, and IR+SVF post-I); #, p < .05 (vs. IR+PBS); Δ, p < .05 (vs. sham, IR+SVF pre-I, and IR+SVF post-I); ∗∗, p < .05 (vs. IR+SVF pre-I). Abbreviations: E-cad, E-cadherin; IR, ischemia/reperfurion; PBS, phosphate-buffered saline; PCNA, proliferating cell nuclear antigen; SVF Post-I, postischemic administration of stromal vascular fraction; SVF Pre-I, preischemic administration of stromal vascular fraction; TUNEL, terminal transferase-mediated deoxyuridine triphosphate nick-end-labeling.

