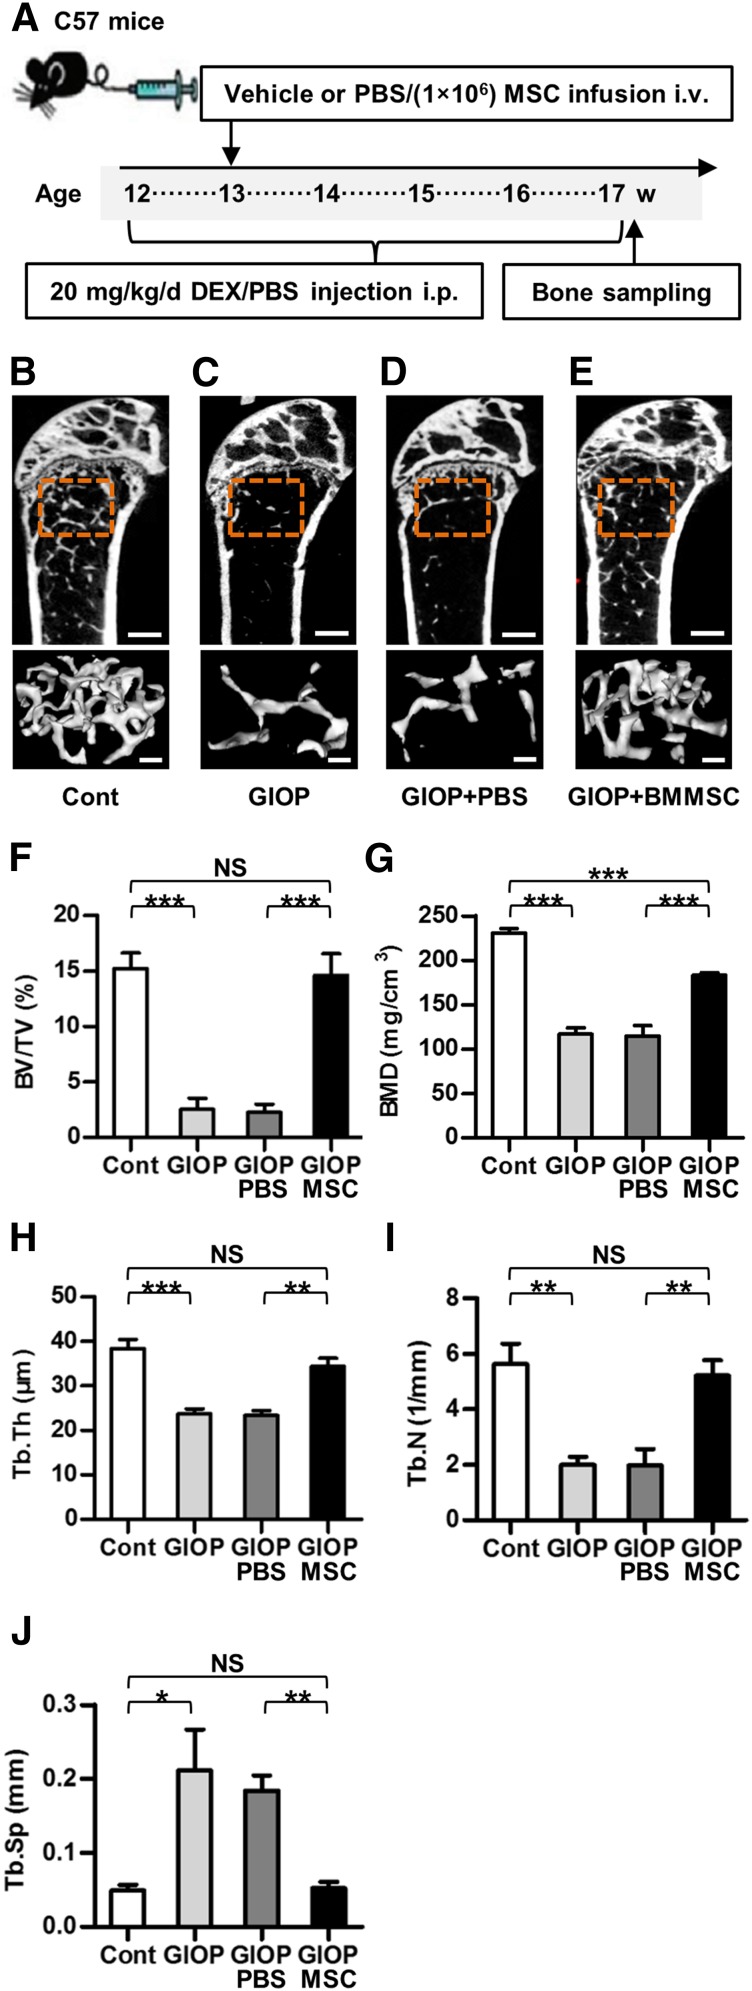
Figure 1.
Study design of Experiment 1 and trabecular bone mass. (A): Study design of the Experiment 1 for bone mass evaluation. Femora and the tibiae were sampled at sacrifice. (B–E): Representative micro-CT images illustrating trabecular bone mass of the distal metaphyses of femora. ROI was defined 0.3–0.8 mm away from epiphyses. Scale bars: 500 μm (top) and 100 μm (bottom). (F–J): Corresponding parameters showing prevention of GIOP by MSC therapy. Data represent mean ± SEM; n = 4 per group. ∗∗, p < .01; ∗∗∗, p < .001. Abbreviations: BMD, bone mineral density; BMMSC, bone marrow-derived mesenchymal stem cell; BV/TV, bone volume per tissue volume; Cont, control; DEX, dexamethasone; GIOP, glucocorticoid-induced osteoporosis; i.p., intraperitoneally; i.v., intravenously; micro-CT, micro-computed tomography; MSC, mesenchymal stem cell; NS, not significant; PBS, phosphate-buffered saline; ROI, region of interest; Tb.N, trabecular bone number; Tb.Th, trabecular bone thickness; Tb.Sp, trabecular separation; w, weeks.

