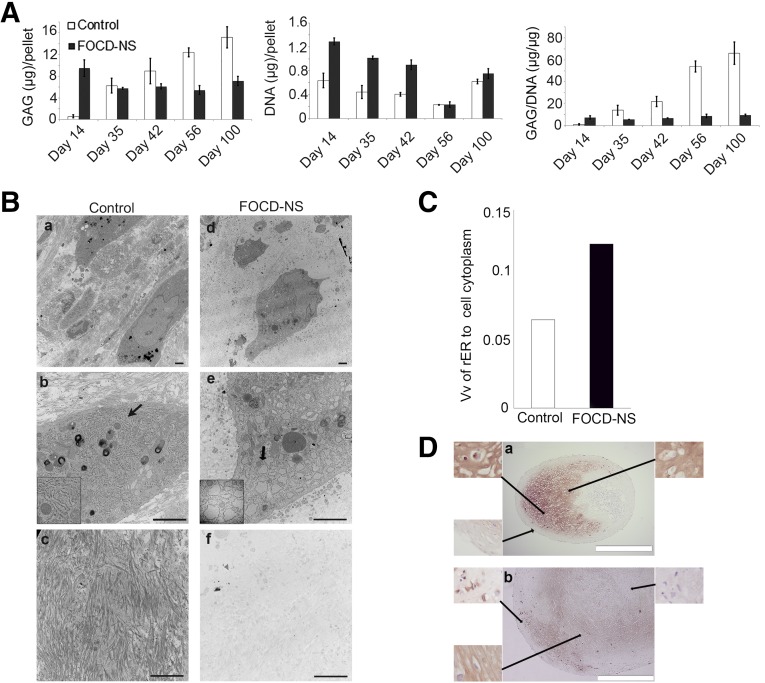
Figure 4.
Examination of ECM formation and chondrocyte status in micromass cultures derived from control and FOCD-NS BM-MSCs. (A): Quantification of GAG and DNA amounts in micromass cultures harvested at different time points. Average (± SD) ratios of GAG to DNA are shown. (B): Day-56 TEM images showed the distribution of protein fibers in ECM (a, c, d, and f) and the ultrastructure of chondrocytes (b and e). The structure of rER is indicated by black arrows (b and e), with the corresponding magnified region shown bottom left in each case. The components of ECM in each group are showed in c and f. Scale bar, 2 µm. (C): Volume fractions of rER to cell cytoplasm in control and FOCD-NS sections. (D): Immunostaining of collagen type II (brown) in control (a) and FOCD-NS (b) sections from the day-42 cultures. Cell nuclei were stained with hematoxylin (blue). Scale bar, 500 µm. Abbreviations: BM-MSC, bone marrow mesenchymal stem cell; ECM, extracellular matrix; FOCD-NS, familial osteochondritis dissecans from northern Sweden; GAG, glycosaminoglycan; rER, rough endoplasmic reticulum; TEM, transmission electron microscopy; Vv, volume fraction.

