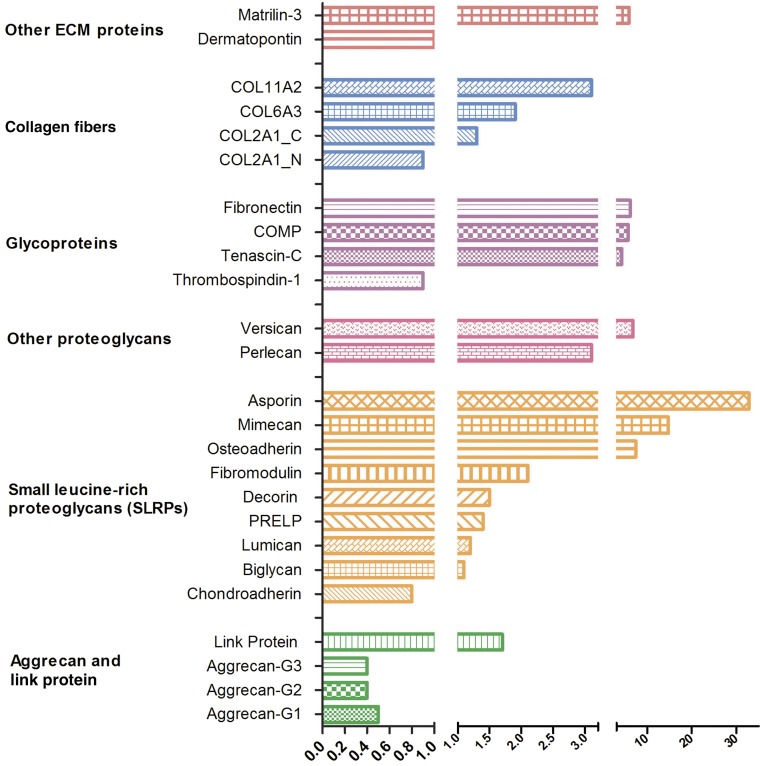
Figure 5.
Quantitative analysis of ECM proteins. ECM proteins in day-100 chondrogenic micromass cultures derived from healthy and FOCD-NS BM-MSCs were quantified using mass spectrometry. Three to six transitions for each protein were measured. The average amount of transition was calculated and normalized to the representative pellet volume to represent the corresponded protein. The mean ratio of protein expression of FOCD-NS to control was calculated (n = 3). A value lower than 1 means protein is down-regulated in the patient sample. Abbreviations: BM-MSC, bone marrow mesenchymal stem cell; COMP, cartilage oligomeric matrix protein; ECM, extracellular matrix; FOCD-NS, familial osteochondritis dissecans from northern Sweden.

