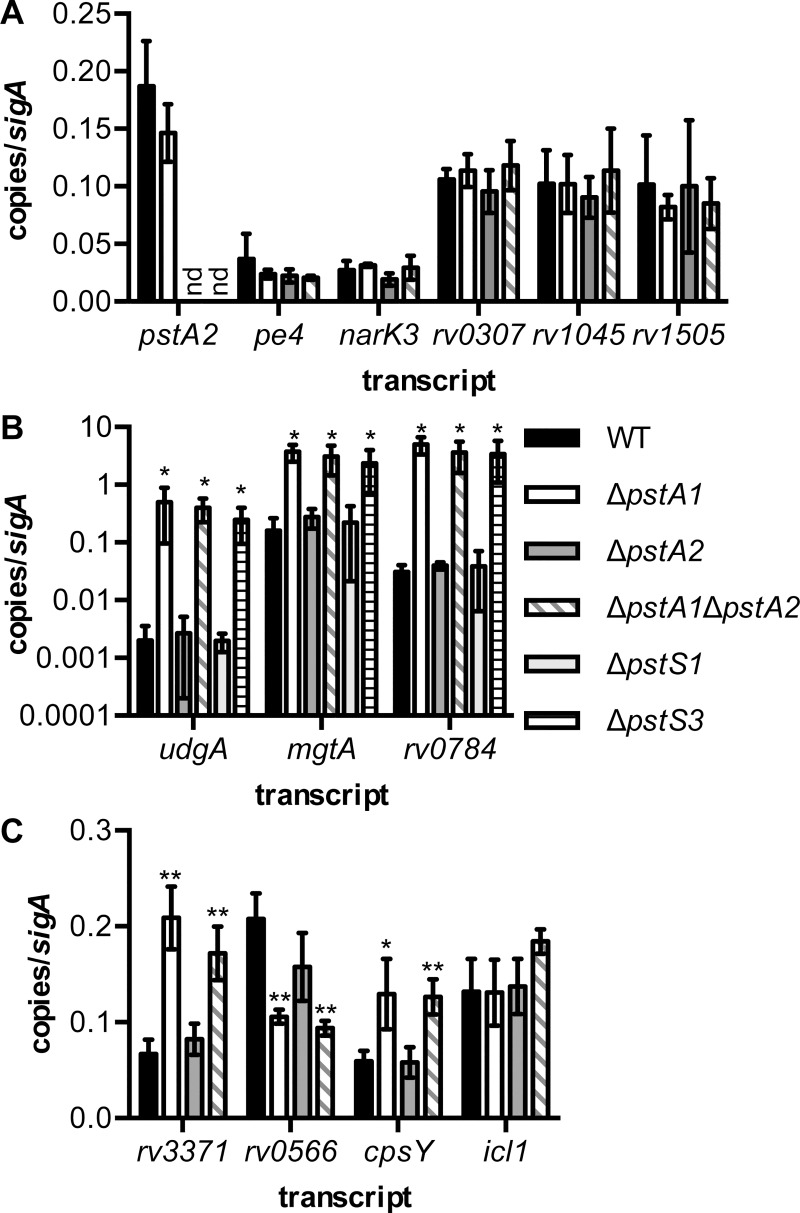
Fig 2. Quantitative RT-PCR analysis of gene expression in M. tuberculosis pst deletion mutants.
RNA was extracted from cultures of M. tuberculosis WT (black), ΔpstA1 (white), ΔpstA2 (dark gray), ΔpstA1ΔpstA2 (diagonal stripes), ΔpstS1 (light gray), and ΔpstS3 (horizontal stripes) bacteria grown to mid-exponential phase (OD600 of 0.5) in Pi-rich 7H9 medium. Transcript abundance relative to abundance of sigA was determined by real-time quantitative RT-PCR. Data shown are the mean ± standard deviation of three independent experiments. nd indicates transcripts that were undetectable in ΔpstA2 and ΔpstA1ΔpstA2 bacteria. Asterisks indicate statistically significant differences from the WT control: *P < 0.05, **P < 0.005. (A) Validation of transcriptional profiling of ΔpstA2 bacteria. (B) Transcripts that are differentially expressed in ΔpstA1 bacteria in a RegX3-dependent manner. (C) Transcripts predicted by microarray analysis to be differentially expressed by ΔpstA1ΔpstA2 bacteria.

