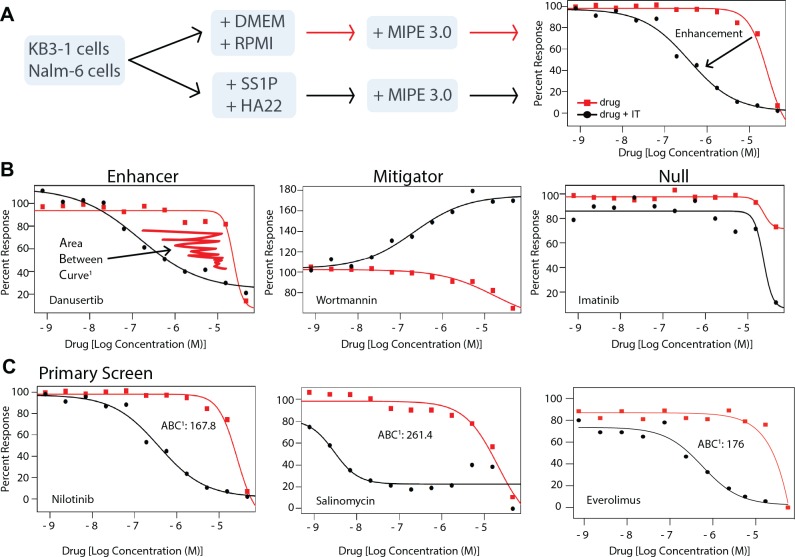
Fig 1. A chemical genetics screen that identifies enhancers and mitigators of immunotoxin-based cellular toxicity.
A. A schematic outlines the screening flow. Either KB3-1 cells or Nalm-6 cells were treated with media or the appropriate immunotoxin (SS1P for KB3-1 or HA22 for Nalm-6) at a predetermined concentration that was sublethal to the plurality of cells. A quantitative 'high throughput screen' of the MIPE-3.0 library of approved and investigational drugs was conducted generating an 11-point dose response curve for all agents. The curves for each agent alone (red line) or plus immunotoxin (black line) were then compared in order to identify enhancement or mitigation. B. An illustration of a strong enhancer (danusertib), mitigator (wortmannin) and an agent with null effect (imatinib). These curves were recorded in the KB3-1 screen. C. The primary screening outcomes for nilotinib, salinomycin and everolimus. The curves for nilotinib and salinomycin were recorded in the KB3-1 screen while the everolimus curve is taken from the Nalm-6 screen. The Area Between the Curve1 score is derived from the differences between the area under the curve (AUC) for each dose response as computed using the trapezoidal rule (see the SI for methods). Primary screening assays were read at 48 hours.

