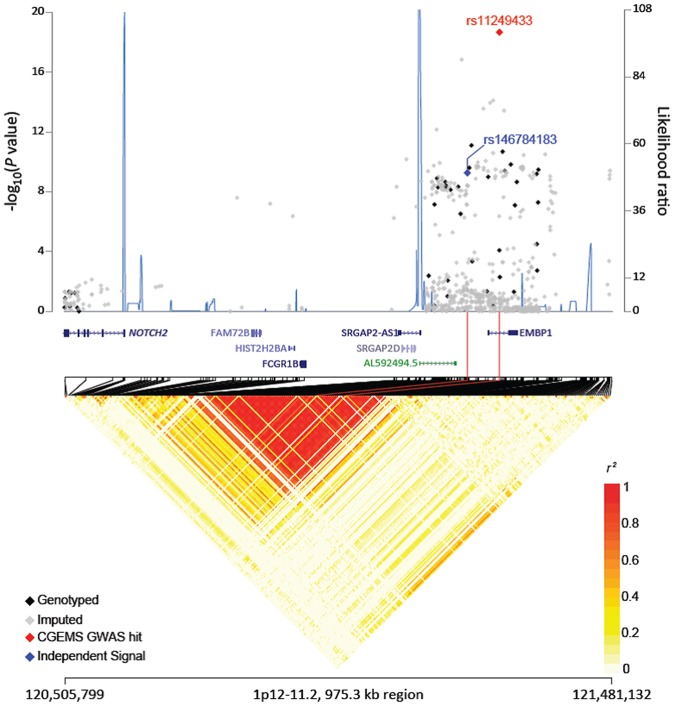
Fig 1. Regional plots of breast cancer association in 1p12-11.2.
Regional plot of association result, recombination hotspots and linkage disequilibrium for the 1p12-11.2:120,505,799–121,481,132 breast cancer susceptibility loci. Association result from a trend test in—log10Pvalues (y axis, left; red diamond, the top ranked breast cancer associated locus in the region; blue diamond, best conditioned analysis results conditioned on rs11249433; black diamonds, genotyped SNPs; gray diamonds, imputed SNPs) of the SNPs are shown according to their chromosomal positions (x axis). Linkage disequilibrium structure based on the 1000 Genomes CEU data (n = 85) was visualized by snp.plotter software. The line graph shows likelihood ratio statistics (y axis, right) for recombination hotspot by SequenceLDhot software based on the background recombination rates inferred by PHASE v2.1. Physical locations are based on hg19. Gene annotation was based on the NCBI RefSeq genes from the UCSC Genome Browser.

