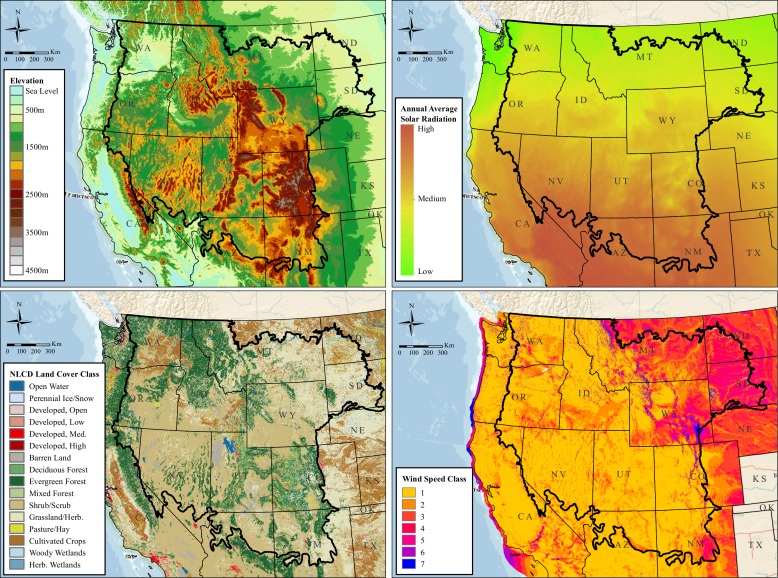
Fig 3. Maps depicting the four covariates in the final resource selection function.
The final model contained covariates representing the median elevation (top left), median annual average solar radiation (top right), proportion of forested and developed land (bottom left), and median wind speed class (bottom right) in each sampled 2-km x 10-km rectangular cell within the study area. Image background is from The National Map (United States Geological Survey).

