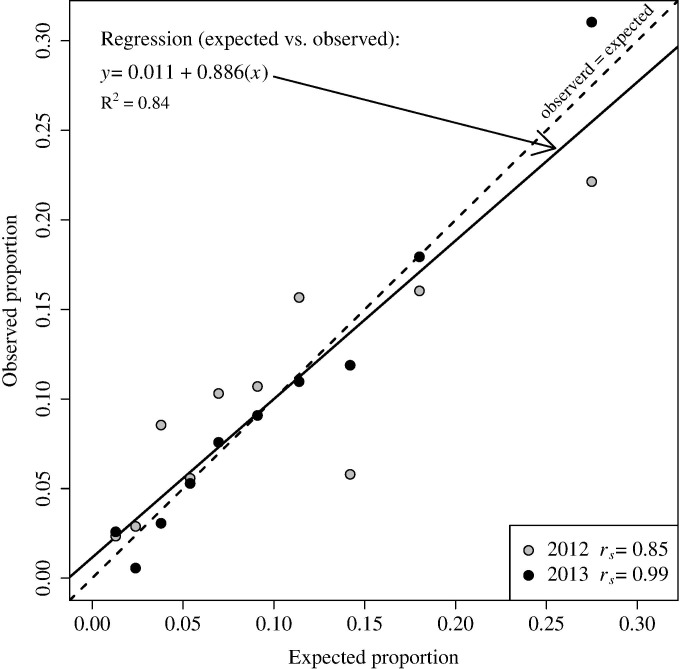
Fig 4. Expected versus observed proportion of golden eagle observations for the 2012 (grey circles) and 2013 (black circles) surveys in 10 habitat use bins.
A perfect relationship between expected and observed use would occur along a line with an intercept of 0 and a slope of 1 (dashed line). The fitted relationship between observed and expected is shown as a solid line, and results of a Spearman’s rank correlation analyses (rs) are provided for each year.

