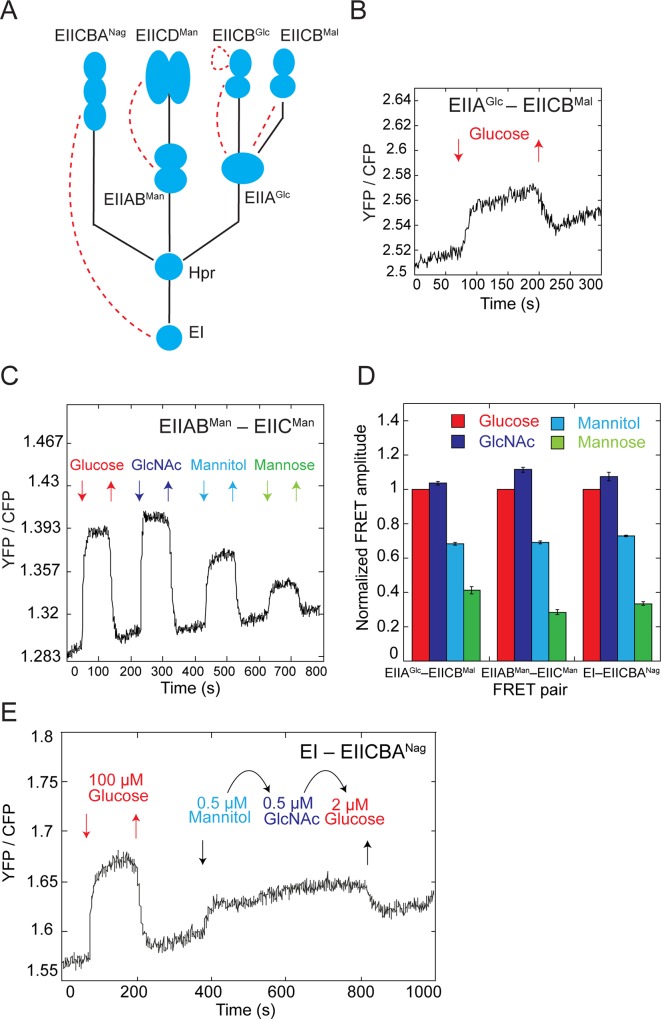
Fig 1. Stimulation dependence of interactions between PTS components.
(A) Schematic representation of a part of the PTS network that shows branches for uptake of glucose (EIIGlc and EIIMal), mannose (EIIMan), and N-acetylglucosamine (GlcNAc) (EIINag). Phosphotransfer reactions between components are shown with solid lines and observed stimulation-dependent protein interactions are shown with dashed lines. Note that EIIAGlc is shared between EIIGlc and EIIMal, and EIIMan has an additional component EIIDMan. (B) Example of a FRET measurement for a pair of glucose-specific PTS components. Cells expressing EIIAGlc-CFP and EIICBMal-YFP were stimulated by the stepwise addition of PTS sugars and the response was followed as a change in the ratio of YFP to CFP fluorescence. Measurements were acquired every second for a population of several hundred cells, as described in Materials and Methods. (C) Example of a FRET measurement for a EIIABMan-YFP and EIICMan-CFP pair upon stimulation by the stepwise addition of 100 μM of the indicated PTS sugars. (D) The amplitude of FRET response for indicated pairs to saturating levels (100 μM) of PTS sugars, normalized to the glucose response. Error bars indicate standard errors of the mean of three independent replicates. The underlying data for Fig 1D can be found in S1 Data. (E) Signaling equivalency of different PTS sugars. Cells expressing EI-CFP and EIICBANag -YFP were stimulated with the indicated subsaturating concentrations of mannitol, GlcNAc or glucose. The response to a saturating glucose stimulus is shown for a reference.

