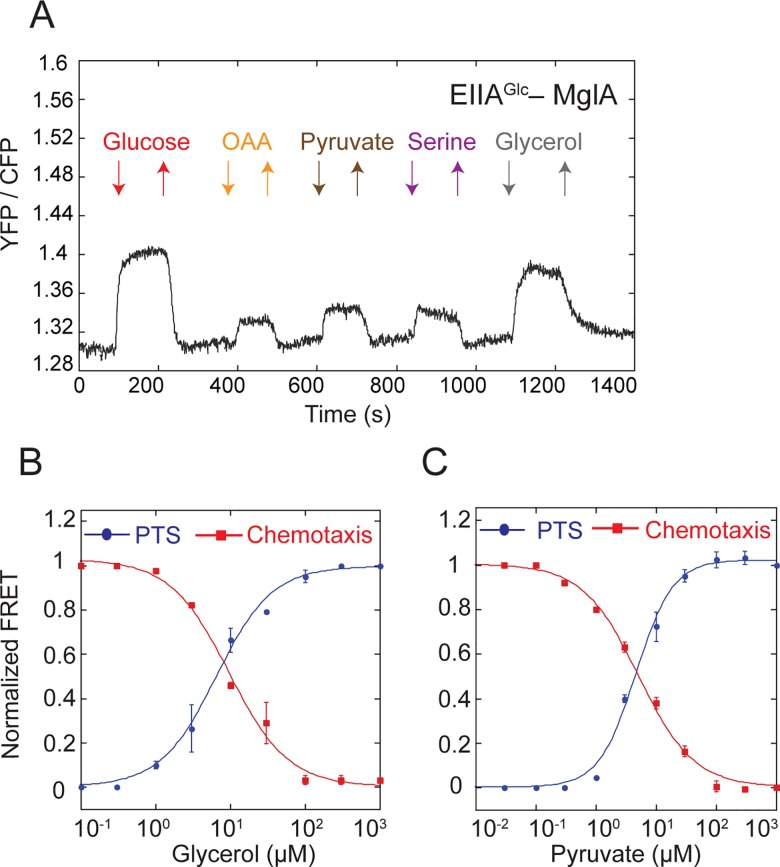
Fig 4. PTS network integrates other metabolic signals.
(A) Measurement of the FRET response for cells expressing EIIAGlc-CFP and MglA-YFP and stimulated with 100 μM of indicated non-PTS compounds. (B, C) Dose-response measurements for cells expressing EIIAGlc-CFP and MglA-YFP (PTS) or CheZ-CFP and CheY-YFP (chemotaxis) pairs and stimulated by stepwise addition and subsequent removal of varying concentrations of glycerol (B) or pyruvate (C). FRET amplitude was normalized to the response at saturating stimulation. Data were fitted using a Hill equation (lines). Error bars indicate standard error of the mean of three independent experiments. The underlying data for Fig 4B and 4C can be found in S1 Data.

