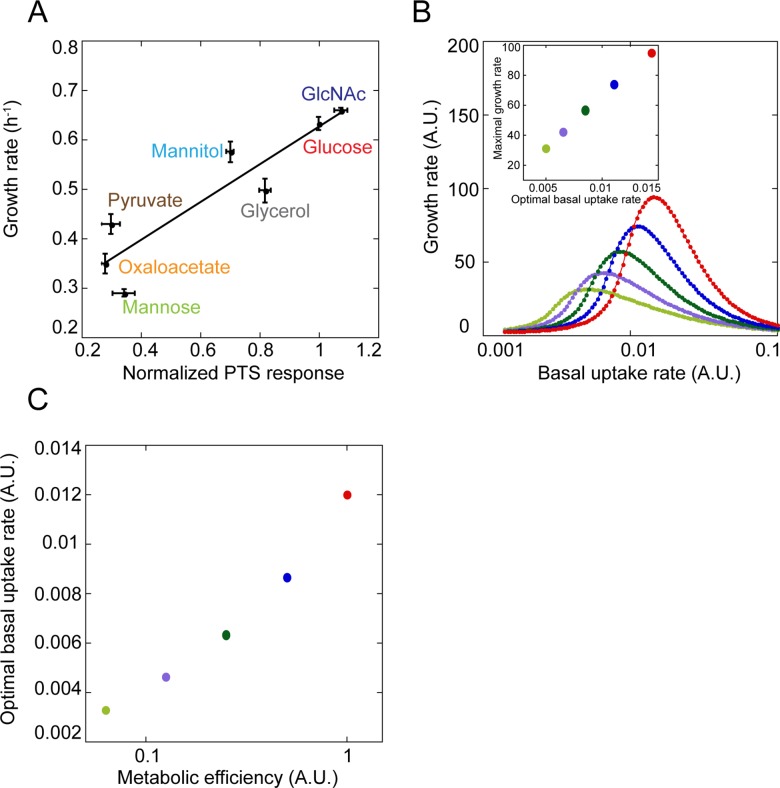
Fig 5. Correlation between default uptake and metabolic efficiency of a carbon source.
(A) The averaged relative response of EIIAGlc–MglA, EIIABMan–EIICMan and EI–EIICBANag FRET pairs to saturating concentration of indicated metabolites, normalized to the glucose response and plotted against the growth rate of exponential E. coli culture in minimal medium supplemented with the respective metabolite. Solid line indicates linear fit to the data, with R2 = 0.83, p = 0.004. The underlying data for Fig 5' A can be found in S1 Data. (B) Simulations of the growth rates at various basal uptake rates, computed for five different values of metabolic efficiency of a carbon source (marked by different colors). Note that the color code is not related to (A). Simulations were performed using the mathematical model described in S1 Text. Inset shows the maximal growth rate as a function of the optimal basal uptake rate for different metabolic efficiency of the carbon source, with the same color code as in the main panel. (C) Correlation between the relative metabolic efficiency of the carbon source and its optimal basal uptake rate for simulated growth on two carbon sources.

