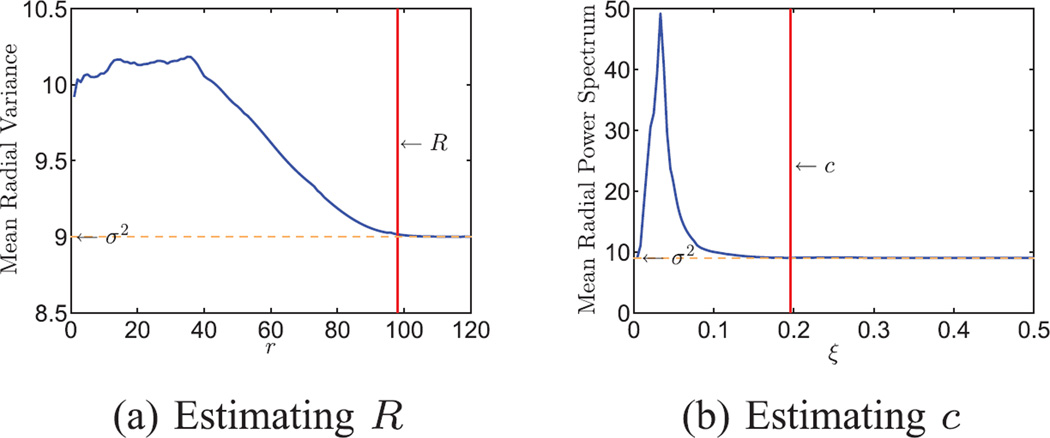
Fig. 5.
Estimating R and c from n = 105 simulated noisy projection images of a human mitochondrial large ribosomal subunit. Each image is of size 240 × 240 pixels. (a) Mean radial variance of the images. The curve levels off at about σ2 = 9 when r ≥ 98. The radius of compact support is chosen as R = 98. (b) Mean radial power spectrum. The curve levels off at σ2 = 9 when ξ ≥ 0.196. The band limit is chosen as c = 0.196.

