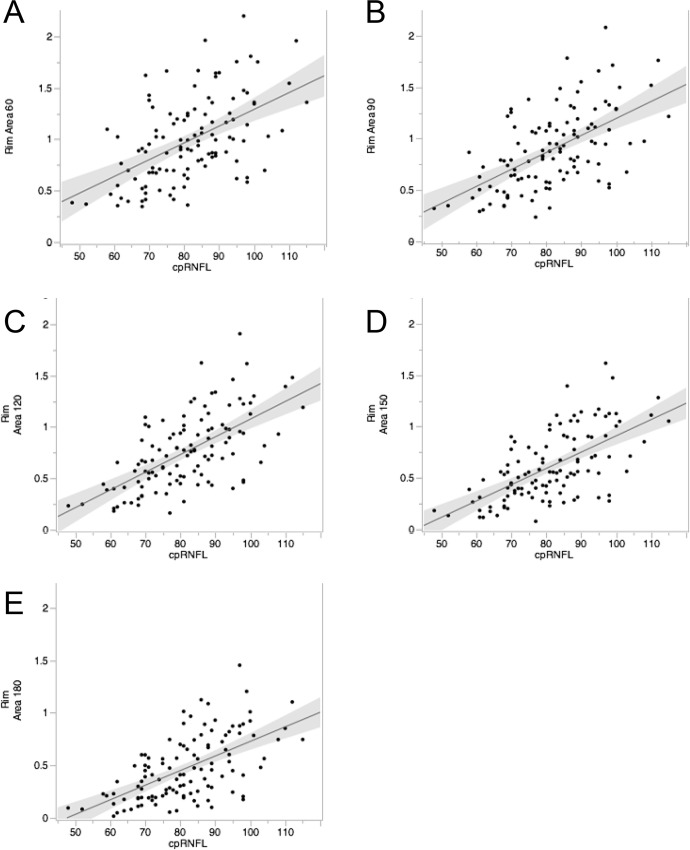
Fig 2. The relationship between rim area and cpRNFLT when the reference plane was set at different heights.
(Pearson’s product/moment correlation coefficient) Scatter plot showing the relationship between rim area and cpRNFLT at reference plane height of 60 (A), 90 (B), 120 (C), 150 (D), and 180 (E) μm. The highest correlation between rim area and cpRNFLT was at 120 μm in the overall group of subjects.

