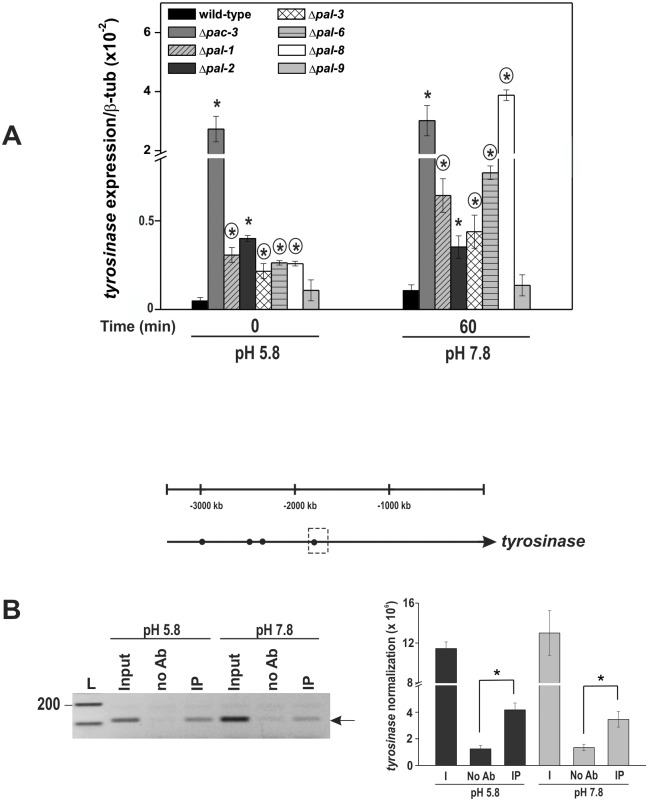
Fig 2. Expression of the tyrosinase gene in the wild-type and the Δpal mutant strains at normal (5.8) and alkaline (7.8) pH.
(A) Mycelial samples from the wild-type and Δpal mutant strains cultured at pH 5.8 for 24 h and shifted to pH 7.8 for 1 h were used to extract total RNA. Gene expression analysis was performed by RT-qPCR on the StepOnePlus™ Real-Time PCR system (Applied Biosystems) using Power SYBR® Green and specific primers. The tub-2 gene was used as the reference gene. The asterisks indicate significant differences compared to the wild-type strain at the same pH, and circles indicate significant differences between the same mutant strain cultured at a different pH (Student’s t-test, P < 0.01). (B) Representation of the PAC-3 motifs (black circles) in the tyrosinase gene promoter. Dashed boxes indicate the region analyzed by ChIP-PCR. Genomic DNA samples from the Δpac-3 complemented strain subjected to pH stress or not were immunoprecipitated with an anti-mCherry antibody and subjected to PCR using specific primers. The input DNA (I) was used as the positive control, and the reactions without any antibody (no Ab) were used as the negative control. The intensity of the DNA bands in the gel (left side, arrow) was quantified by ImageJ and the results are shown in the right figure. L, 1 kb DNA ladder. *Asterisks indicate significant differences between the no Ab and IP samples at the same pH (Student’s t-test, P < 0.01). All results represent the average of at least three independent experiments. Bars indicate the standard deviation from the biological experiments.

