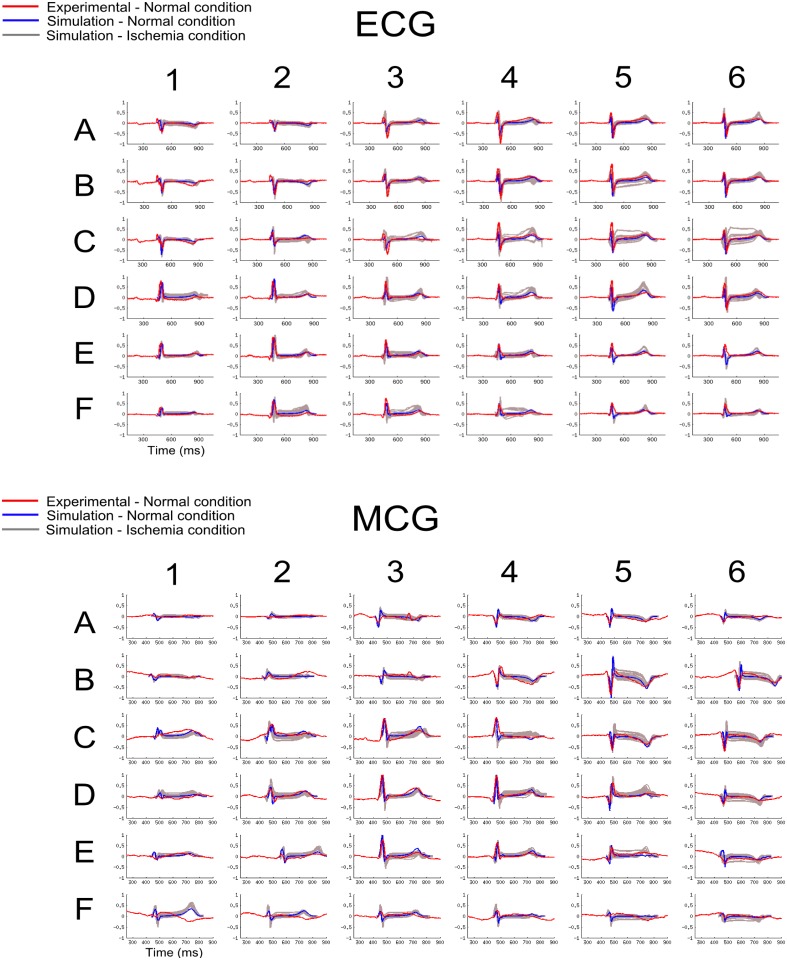
Fig 4. Simulated 36-lead ECG and MCG under control and ischemic conditions.
Simulated 36-lead ECG (top panels) and MCG (bottom panels) in control (blue line) and ischemic (grey line) conditions. In control conditions, ECG and MCG were normalized and superimposed with experimental data [18] (red line), simulated data (blue line) during control and ischemic conditions (Phase A with variant locations; grey lines). The numbers and letters represent the electrode/sensor position (Fig 1B-ii). Simulated 36-lead ECG and MCG were normalized to the maximum amplitude of each lead, and superimposed over experimental recordings from a healthy subject.

