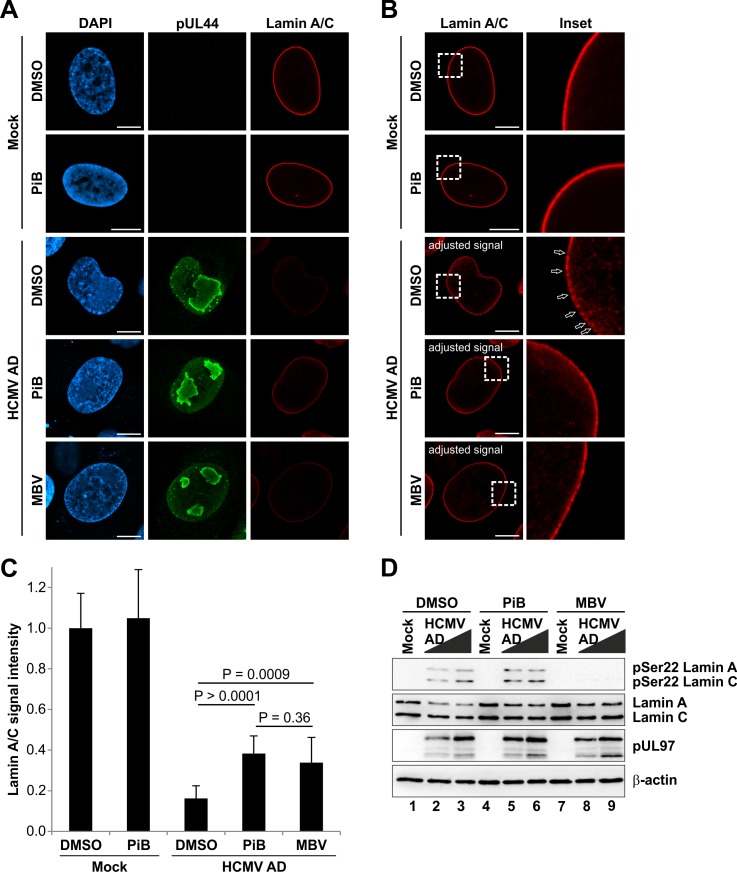
Fig 7. Reduced lamina disassembly upon inhibition of Pin1 activity in HCMV-infected cells.
HFFs were infected with HCMV AD at a MOI of 0.01 or remained uninfected (mock). At 48 hpi, cells were treated with DMSO, 10 μM PiB or 5 μM MBV as indicated. Cells were fixed at 72 hpi followed by immunofluorescence staining using rabbit mAb-lamin A/C to visualize the nuclear lamina in red. Staining of HCMV pUL44 served as a viral marker in green. (A) Representative images of confocal planes demonstrating the effect of inhibitory compounds on the distribution of lamin A/C (raw images). (B) Lamin A/C signals of images depicted in (A) were adjusted to levels of uninfected control cells treated with DMSO for qualitative analysis of lamin A/C distribution. Insets show the magnification of dashed boxes. Open arrows, lamina-depleted areas; scale bars, 10 μm. (C) Quantitation of lamin A/C signals. Signal intensities from raw images were measured along the nuclear rim (mean of 10 cells in each case, ± standard deviation; statistical significance was determined by Student’s t-test). (D) Effect of PiB on the HCMV-induced Ser22 phosphorylation. HFFs were infected with HCMV at MOIs of 0.1 and 1.0. At 48 hpi, cells were treated with DMSO, 10 μM PiB, and 5 μM MBV. Cells were lysed at 72 hpi and lysates were subjected to standard Western blot analysis for detection of lamin A/C phosphorylated at Ser22 (upper panel), total lamin A/C (second panel), viral protein kinase pUL97 (third panel), and loading control β-actin (lower panels).

