
Fig 2. Pharmacological modulation of human Nav1.9.
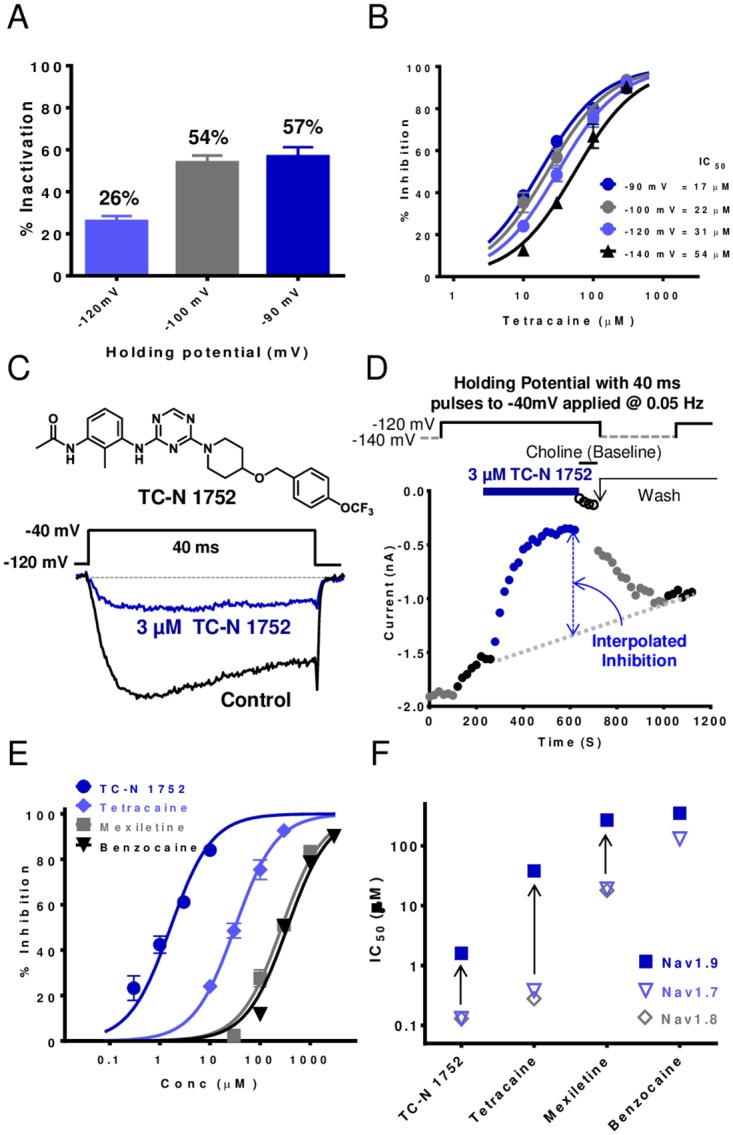
(A) Magnitude of Nav1.9 inactivation at different holding potentials. Percent inactivation determined from decline in test pulse current amplitude applied every 20s from test holding potential to -40 mV (values are mean ± SEM for 11–12 observations). (B) Comparison of concentration dependence of Nav1.9 inhibition by tetracaine at different holding potentials. (C) Representative current traces recorded in HEK-hNav1.9 cell line in the presence and absence of 3 μM TC-N 1752 (structure shown) during a 40 ms voltage step from -120 mV to -40 mV. (D) Diary plot of Nav1.9 current amplitude recorded using 40 ms voltage steps to -40 mV applied at 0.05 Hz, initially from a holding potential of -140 mV, then at -120 mV to induce ~25% inactivation. After current amplitude was stable at -120 mV, test agent was applied. Washout of test agent at holding potential of -140 mV until current amplitude became stable and then holding potential reset to -120 mV to allow inhibition to be determined by dividing current amplitude in presence of compound by interpolated current amplitude (see dotted line) between prior to compound addition and after washout. (E) Concentration response relationships for inhibition of Nav1.9 currents by known Nav channel inhibitors TC-N 1752, tetracaine, mexiletine and benzocaine. IC50s for these agents are plotted in (F) (values are summarized in Table 5) and are compared to IC50s for inhibition of Nav1.7 and Nav1.8 (values are summarized in Table 6).